
Thursday, June 30, 2011
Cycles and QE2
We do not know the impact of the end of QE2, We do know the impact though QE2 Japan ending had. I have copied a chart from http://www.safehaven.com/article/21532/qe2-ends-long-live-the-free-market-ha
![]() We see that the ending of QE2 in Japan was followed by a downside market. I know of no other real example.....
We see that the ending of QE2 in Japan was followed by a downside market. I know of no other real example.....
Comments and outlook 07-01-2011
I told you last night I could not understand or explain based on my cycle analysis the levels of the market. Now I could have thrown out a lot of BS explanations like this:
1). Tomorrow is the solar eclipse following the lunar eclipse on June 15. Basically the stock market headed down with the first solar eclipse on June 1st and bottomed on the lunar eclipse on June 15th and now is rallying into the latest solar eclipse. Puetz crash theory stipulates that a lunar eclipse following a solar eclipse generally initiates a hard down phase (it doesn't always happen).
2). July 1st is a new moon and a full moon is on July 15th. The market usually tops on a full or new moon. Note: at this time the moon cycle and 22TD cycle are much the same.
3) Spiral date calendar was high Jun 27-30: http://spiraldates.com/2011/charts/scores_0611.png
This is just a sample of what I could have said, and even though I sometimes point out these things they are not a critical part of my cycle analysis. But I could have offered these and more excuses for index levels I could not explain using cycles. I am not telling you not to look at these things (I do).
OK, what does tomorrow offer? Today should have been the top of the 22TD cycle. It will take 2-3 days for the 22TD cycle to gain downside momentum. If you look at the SPY chart I will present you will see this is because some of the shorter cycles are pushing up at this time.
So the 22TD cycle is down. The 11.2TD cycle is up, the 5.6TD cycle is up, the 2.8TD is up part of the day and tops by afternoon. So I doubt we can expect any or little downside from this alignment of shorter cycles.
In theory though we have had pressure accumulating from the longer cycles that could begin to take control and move the market down.
Here is the SPY chart:
![]() GL traders. I have accumulated the 2X inverse ETF of the Qs. In addition I have sold August out-of-the calls on 2 long positions to provide some downside insurance and still let me profit some if I am wrong and the market advances. Even in down markets I will hold some long positions on stocks that have good chart patterns. Be careful.
GL traders. I have accumulated the 2X inverse ETF of the Qs. In addition I have sold August out-of-the calls on 2 long positions to provide some downside insurance and still let me profit some if I am wrong and the market advances. Even in down markets I will hold some long positions on stocks that have good chart patterns. Be careful.
1). Tomorrow is the solar eclipse following the lunar eclipse on June 15. Basically the stock market headed down with the first solar eclipse on June 1st and bottomed on the lunar eclipse on June 15th and now is rallying into the latest solar eclipse. Puetz crash theory stipulates that a lunar eclipse following a solar eclipse generally initiates a hard down phase (it doesn't always happen).
2). July 1st is a new moon and a full moon is on July 15th. The market usually tops on a full or new moon. Note: at this time the moon cycle and 22TD cycle are much the same.
3) Spiral date calendar was high Jun 27-30: http://spiraldates.com/2011/charts/scores_0611.png
This is just a sample of what I could have said, and even though I sometimes point out these things they are not a critical part of my cycle analysis. But I could have offered these and more excuses for index levels I could not explain using cycles. I am not telling you not to look at these things (I do).
OK, what does tomorrow offer? Today should have been the top of the 22TD cycle. It will take 2-3 days for the 22TD cycle to gain downside momentum. If you look at the SPY chart I will present you will see this is because some of the shorter cycles are pushing up at this time.
So the 22TD cycle is down. The 11.2TD cycle is up, the 5.6TD cycle is up, the 2.8TD is up part of the day and tops by afternoon. So I doubt we can expect any or little downside from this alignment of shorter cycles.
In theory though we have had pressure accumulating from the longer cycles that could begin to take control and move the market down.
Here is the SPY chart:

Wednesday, June 29, 2011
Outlook for 06-30-2011
Tomorrow morning should mark the top of the 22TD cycle.
I can't explain the level of the market. Every analysis I run indicates it should be at least 10 points (and probably more) lower using the most optimistic assumptions. Greeks rioting is evidently good for the market. I suppose if the Greeks had burned down a building it would be even higher.
Here is the SPY:
![]() GL traders. Interesting similarity between 06/21 and today.
GL traders. Interesting similarity between 06/21 and today.
I can't explain the level of the market. Every analysis I run indicates it should be at least 10 points (and probably more) lower using the most optimistic assumptions. Greeks rioting is evidently good for the market. I suppose if the Greeks had burned down a building it would be even higher.
Here is the SPY:

Tuesday, June 28, 2011
Comments and outlook for 06-29-2011
Strike two!! OK, not a swing and a miss - more like a foul ball. I talked about the 22TD cycle last evening and how it was hard up, but thought maybe it would lose some of its upward "mo". It didn't.
So let's try again. Tomorrow the 22TD cycle should top by EOD or early the following day and as it is topping it should lose its ramp up momentum. We have the 22TD cycle up and topping toward the end of the day tomorrow. We have the 11.2TD, 5.6TD, and 2.8TD cycles down and bottoming toward the end of the day (or early the next day). This should limit the upside for the 22TD cycle. There are a cluster of tops 1298-1299 so I am expecting this may provide upside resistance and limit any upside tomorrow. We may see 1300, but I doubt we approach the next FIB at 1310.30. WARNING: I could be off by 2-4 hours in regards to the top.
In addition to the 3 shorter cycles being down we have the 20 week (Wall) cycle down and the 1 year cycle ready to bottom in early July. Given this setup I do not see how there is a lot of upside left before we reverse to the down side as soon we will have the 22TD, and the 20week cycles down and the 1 year cycle bottoming... So tomorrow I expect very moderate upside, but possibly red by EOD.
Here is the SPY visual:
![]() GL traders. Do your own analysis.
GL traders. Do your own analysis.
So let's try again. Tomorrow the 22TD cycle should top by EOD or early the following day and as it is topping it should lose its ramp up momentum. We have the 22TD cycle up and topping toward the end of the day tomorrow. We have the 11.2TD, 5.6TD, and 2.8TD cycles down and bottoming toward the end of the day (or early the next day). This should limit the upside for the 22TD cycle. There are a cluster of tops 1298-1299 so I am expecting this may provide upside resistance and limit any upside tomorrow. We may see 1300, but I doubt we approach the next FIB at 1310.30. WARNING: I could be off by 2-4 hours in regards to the top.
In addition to the 3 shorter cycles being down we have the 20 week (Wall) cycle down and the 1 year cycle ready to bottom in early July. Given this setup I do not see how there is a lot of upside left before we reverse to the down side as soon we will have the 22TD, and the 20week cycles down and the 1 year cycle bottoming... So tomorrow I expect very moderate upside, but possibly red by EOD.
Here is the SPY visual:

Monday, June 27, 2011
comments and outlook for 06-28-2011
Update - noon - the 22TD cycle contines to ramp up. One more day (tomorrow) to the top.
My call for today was totally wrong!!! Of course, if you do this you will be wrong some of the time. Question I am asking myself is if I need to adjust/reposition my placement of the cycles. But, I need more time/data to make that decision.
One thing you will learn if you trade is - you may expect something and the opposite happens. When that happens you have decide how to play it. You always play the market in front of you - not what you thought would happen. So with the market up substantially (and the NAZ up the most) I took a partial position in QID (double inverse ETF of the NAZ 100) because I believe the downside is not complete. If I am wrong I lose.
Tomorrow it looks like the 11.2TD and 5.6TD cycles should be down. The 22TD cycle is hard up into a top. The 2.8TD is up. With the 22TD hard up into a top there may be an upward bias to the short cycles (that appeared to be the case today). So the longer cycles (20 week and 1 year) may decide the outcome tomorrow. The 22TD cycle spent quite a bit of its upside amplitude today. So I expect tomorrow will be down. I could be wrong (again) if I am wrong about the strength of the 22TD cycle's up momentum.
Here is a chart of the SPY:
![]() GL traders. Be careful and remember - you always have to trade the market in front of you not some opinion on a blog.
GL traders. Be careful and remember - you always have to trade the market in front of you not some opinion on a blog.
My call for today was totally wrong!!! Of course, if you do this you will be wrong some of the time. Question I am asking myself is if I need to adjust/reposition my placement of the cycles. But, I need more time/data to make that decision.
One thing you will learn if you trade is - you may expect something and the opposite happens. When that happens you have decide how to play it. You always play the market in front of you - not what you thought would happen. So with the market up substantially (and the NAZ up the most) I took a partial position in QID (double inverse ETF of the NAZ 100) because I believe the downside is not complete. If I am wrong I lose.
Tomorrow it looks like the 11.2TD and 5.6TD cycles should be down. The 22TD cycle is hard up into a top. The 2.8TD is up. With the 22TD hard up into a top there may be an upward bias to the short cycles (that appeared to be the case today). So the longer cycles (20 week and 1 year) may decide the outcome tomorrow. The 22TD cycle spent quite a bit of its upside amplitude today. So I expect tomorrow will be down. I could be wrong (again) if I am wrong about the strength of the 22TD cycle's up momentum.
Here is a chart of the SPY:

Sunday, June 26, 2011
July 2011 spiral dates
Information to supplement cycle analysis: http://spiraldates.com/2011/charts/scores_0711.png
Comments and outlook for 06-27-2011
Update - 11:40 - well this is not how I thought the market wild behave today (so far).
Last week turned out to be more bearish than I anticipated as it seems the longer cycles took firm control by the last two days of the week. Of interest is Jun 22 was a Bradley Turn date: http://swingcycles.blogspot.com/2010/12/12-15-bradley-turn-dates-2011.html
The next turn day of interest appears to be late July.
So now it appears the 20week cycle down side momentum is picking up and the 1 year cycle is pushing hard to a bottom July 1 or July 5. I expect these 2 longer cycles to dominate Monday.
The 22 TD cycle continues up for about 3 days into Wednesday. The 11.2TD cycle is down. The 5.6 day cycle is up, but should top by 2:30-3:00 in the afternoon. The 2.8TD cycle is down and should bottom about the time the 5.6TD cycle tops. So it appears that the shorter cycle has a neutral to slightly down bias (leaving the control to the longer cycles).
I expect on Monday we will break below the 200 Day MA and probably the 1259.55 FIB and possibly test the Mar low of around 1250.
Here is the visual of the SPY:
![]() GL traders. Do your own analysis. Beware the bear.
GL traders. Do your own analysis. Beware the bear.
Last week turned out to be more bearish than I anticipated as it seems the longer cycles took firm control by the last two days of the week. Of interest is Jun 22 was a Bradley Turn date: http://swingcycles.blogspot.com/2010/12/12-15-bradley-turn-dates-2011.html
The next turn day of interest appears to be late July.
So now it appears the 20week cycle down side momentum is picking up and the 1 year cycle is pushing hard to a bottom July 1 or July 5. I expect these 2 longer cycles to dominate Monday.
The 22 TD cycle continues up for about 3 days into Wednesday. The 11.2TD cycle is down. The 5.6 day cycle is up, but should top by 2:30-3:00 in the afternoon. The 2.8TD cycle is down and should bottom about the time the 5.6TD cycle tops. So it appears that the shorter cycle has a neutral to slightly down bias (leaving the control to the longer cycles).
I expect on Monday we will break below the 200 Day MA and probably the 1259.55 FIB and possibly test the Mar low of around 1250.
Here is the visual of the SPY:

comments on gold - 06-26-2011
I do not follow gold the way some seem to do. If you think about it gold is a very small portion of the real assets in the world when compared to things like oil, coal, natural gas, copper, land, etc. Still it gets more written about it than almost any asset. Personally I think one may be better off investing in raw land. At least then you have an asset that can produce the food you eat. You can't eat gold, there is little demand for it as a component of manufacturing. Other than burying it in the back yard in a chest or making jewelry it has few uses. Yet, many consider it the ultimate store of value and historical it has been an exchange medium.
Depending on who you read gold id going to $2,500 or more or going to $1,000. It may do both? If you look at the low in the past 32 years it is about 600% above that low. But if you look at the high the past 32 years and inflation adjust that high it would have to be over $2,000 to match that high. Pick your point of reference and make your argument....
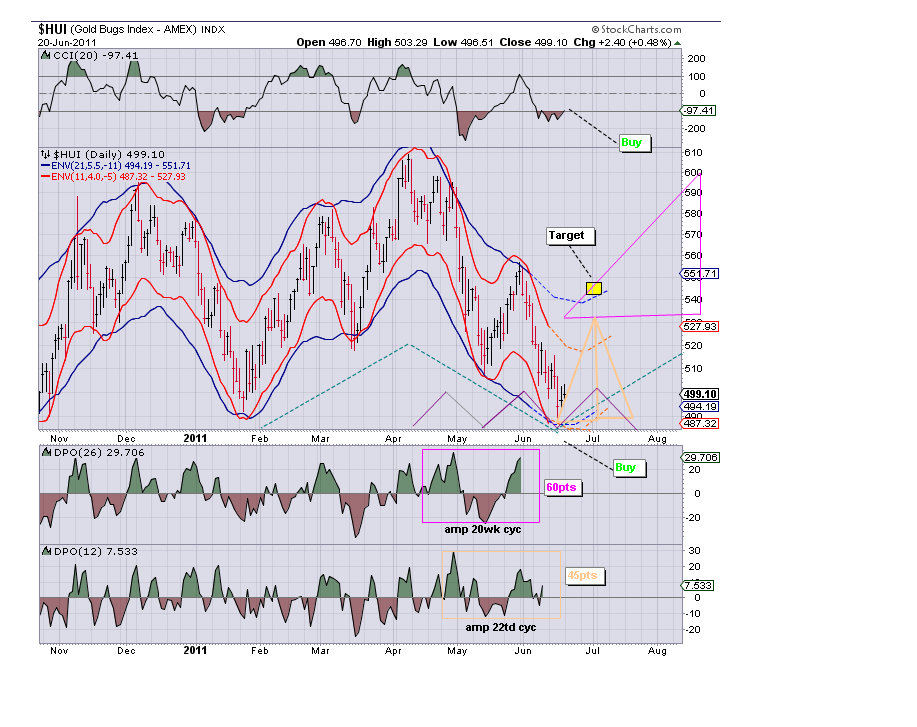
As swing traders though we are more interested in what gold will do in the next few weeks. Many seem to think we get a pullback in the near term and I have seen the number of $1300 mentioned (that would be about a 16% correction from its pear around $1550). I have also seen the number $1650 mentioned more than once or about a 6% advance from its peak.
I took a look and it seems to me we will get a bit more of a correction (at $1500 we are about 3% off the peak), but $1300 seems a bit low. After that we may see an indeterminate advance. I looked at the weekly $GOLD chart and we had a 1 year cycle bottom earlier at around $1500 and have been going sideways between $1500-1550. The logical question is - why? The answer appears to be that we have a 26 week (1/2 year cycle) moving toward a bottom in late July as the 1 year cycle which bottomed around the 1st week of May moves up. Essential these 2 cycles are competing for control of $GOLD causing the sideways movement.
So how does it work out? Looking at DPO to try and determine the amplitude of these two cycles and how it plays out it appears the gold will pull back about another 3% (total 6-7%) to around $1450 by the 3rd or 4th week of July. So while I agree that gold should pull back it seems to me it will be less than many anticipate (at least in the near term).
Here is the $GOLD chart:
![]() Gl traders. Do your own analysis, As always be careful - I could be wrong.
Gl traders. Do your own analysis, As always be careful - I could be wrong.
Depending on who you read gold id going to $2,500 or more or going to $1,000. It may do both? If you look at the low in the past 32 years it is about 600% above that low. But if you look at the high the past 32 years and inflation adjust that high it would have to be over $2,000 to match that high. Pick your point of reference and make your argument....
As swing traders though we are more interested in what gold will do in the next few weeks. Many seem to think we get a pullback in the near term and I have seen the number of $1300 mentioned (that would be about a 16% correction from its pear around $1550). I have also seen the number $1650 mentioned more than once or about a 6% advance from its peak.
I took a look and it seems to me we will get a bit more of a correction (at $1500 we are about 3% off the peak), but $1300 seems a bit low. After that we may see an indeterminate advance. I looked at the weekly $GOLD chart and we had a 1 year cycle bottom earlier at around $1500 and have been going sideways between $1500-1550. The logical question is - why? The answer appears to be that we have a 26 week (1/2 year cycle) moving toward a bottom in late July as the 1 year cycle which bottomed around the 1st week of May moves up. Essential these 2 cycles are competing for control of $GOLD causing the sideways movement.
So how does it work out? Looking at DPO to try and determine the amplitude of these two cycles and how it plays out it appears the gold will pull back about another 3% (total 6-7%) to around $1450 by the 3rd or 4th week of July. So while I agree that gold should pull back it seems to me it will be less than many anticipate (at least in the near term).
Here is the $GOLD chart:

Friday, June 24, 2011
Comment and outlook for week of 06-27-2011
Last week I misjudged the downside potential of the longer cycles at the end of the week and we ended the considerably lower than I had projected. Hopefully I corrected that this week (but not over corrected).
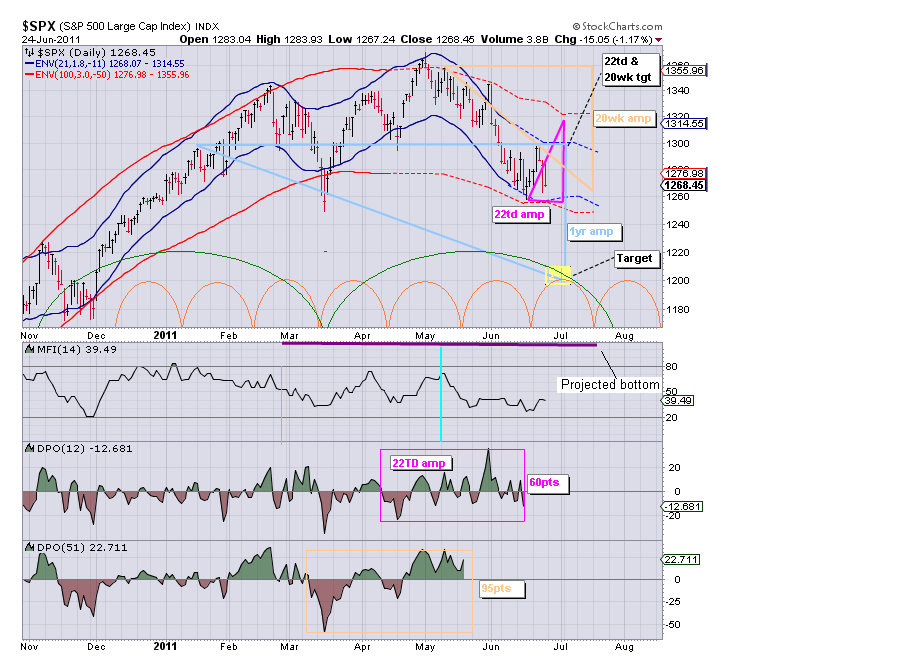
The 20 week cycle is starting to show more downside momentum in my opinion. The 1 year cycle should make a final and very strong thrust as it should bottom around the 1st of July. The fly in the soup is the 22TD cycle should also be topping around the end of the week about the same time the 1 year cycle bottoms. The 22TD cycle has considerable amplitude (around 60 S&P points or 25 points for 5 days). In isolation that would push the S&P to around 1295, but it is not in isolation. The 20 week cycle is down and should subtract 20 or more points giving us a target of 1275 on the S&P for these two cycles.
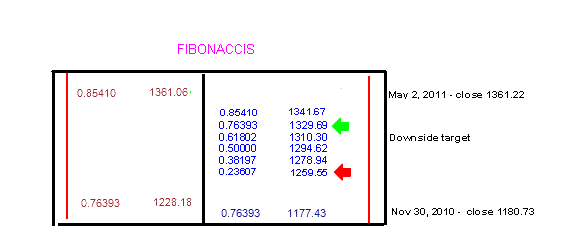
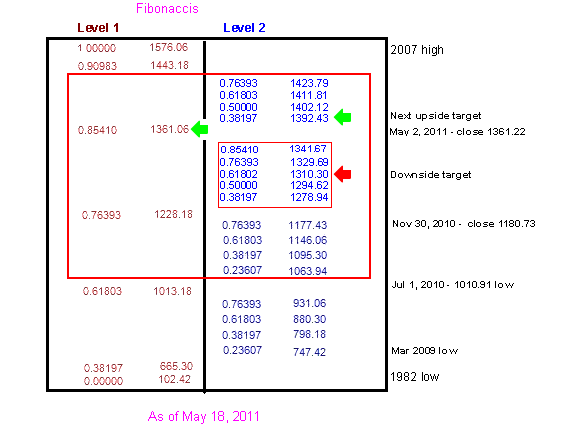
In addition to this we have the 1 year cycle down very hard. I believe this will lead to breaking the 200 day MA around 1263, the FIB at 1259.55 and then the Mar low around 1250 and FIB at 1247.50. It this plays out then the S&P will free fall to the 1228.18 FIB and possibly lower by early July. This could happen as soon as Fri Jul 1, but may be Tue Jul 5 (depending on exactly when the 1 year cycle bottoms). My FIBs targets which I believe will contain the market move are 1196.81 and 1278.94
Now I realize this sounds a bit extreme, but I have to interpret the data as I see it. Here are the FIBS:
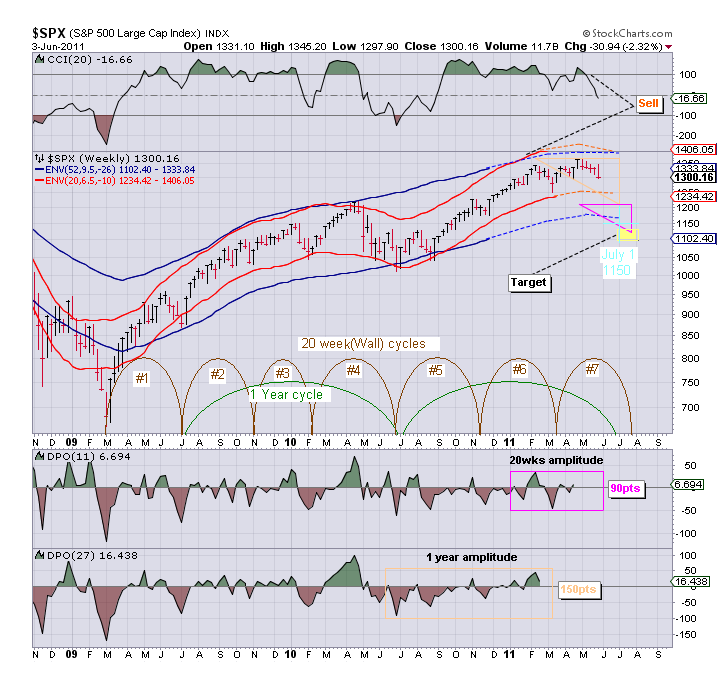
![]() Here is a chart of the SPX showing the 22TD, 20 week and 1 year cycle amplitudes overlaid to produce a target:
Here is a chart of the SPX showing the 22TD, 20 week and 1 year cycle amplitudes overlaid to produce a target: ![]() GL. Do you own analysis - my projections are pretty extreme - but the data as I interpret it seems to support those projections.
GL. Do you own analysis - my projections are pretty extreme - but the data as I interpret it seems to support those projections.
The 20 week cycle is starting to show more downside momentum in my opinion. The 1 year cycle should make a final and very strong thrust as it should bottom around the 1st of July. The fly in the soup is the 22TD cycle should also be topping around the end of the week about the same time the 1 year cycle bottoms. The 22TD cycle has considerable amplitude (around 60 S&P points or 25 points for 5 days). In isolation that would push the S&P to around 1295, but it is not in isolation. The 20 week cycle is down and should subtract 20 or more points giving us a target of 1275 on the S&P for these two cycles.
In addition to this we have the 1 year cycle down very hard. I believe this will lead to breaking the 200 day MA around 1263, the FIB at 1259.55 and then the Mar low around 1250 and FIB at 1247.50. It this plays out then the S&P will free fall to the 1228.18 FIB and possibly lower by early July. This could happen as soon as Fri Jul 1, but may be Tue Jul 5 (depending on exactly when the 1 year cycle bottoms). My FIBs targets which I believe will contain the market move are 1196.81 and 1278.94
Now I realize this sounds a bit extreme, but I have to interpret the data as I see it. Here are the FIBS:

Thursday, June 23, 2011
Comments and outlook for 06-24-2011
Update 12:15 The morning was not according to expectations. The longer cycles appear to be dominating. So, we probably close the week on a down market.
I mentioned the possibility that we could see some carry over from Wednesday's close. Then we got poor employment numbers followed by the action of the IEA. These two news items exaggerated the move down. I would guess it added 150-200 points to the down move as they supported the possible continuation of Wednesday's close.
Then during the day the shorter cycles kicked in and moved the market up. By 2:30-3:00 about half of the severe early sell off had been wiped out. Then shortly before 3:00 PM we got news that an agreement between the IMF-EU-Greece had been reached. This supported the short cycles up move and by the close most of the early day sell off had been eliminated.
News can and does affect cycles. In this case we saw the early market (that probably would have been down) down much more than one would reasonably expect. So the news supported the probable market cyclic action and we had a severe sell off. In the afternoon the IMF-EU-Greece news supported the push up by the shorter cycles and almost wiped out the early day sell down. Still it seemed to me we could see the effect of the cycles (especially between these news events as the shorter cycles pushed up). Yes, news can and does affect the cycles (depending on the news it may exaggerate or suppress the cycles). Today was a great example of news exaggerating the cyclic moves.
Tomorrow we have the shortest cycle - the 2.8TD cycle topping by midday. The 5.6TD cycle is up, The 11.2TD cycle is down. The 22TD cycle is up. So it seems in the early session we may have an up bias, but by afternoon it is down bias from the shorter cycles.
The 20week (Wall) cycle provides moderate down pressure. The 1 year cycle is down hard as it pushes toward a bottom in early July. So, in summary we may get a small rally early in the day followed by what could be a somewhat vigorous sell down in the afternoon. If course that assumes the PTBs don't pull more rabbits out of the hat.
Here is a visual using the SPY:
![]() Gl traders. Be careful. My plan is to short (buy inverse ETFs) on any morning strength. You should make your own plan.
Gl traders. Be careful. My plan is to short (buy inverse ETFs) on any morning strength. You should make your own plan.
I mentioned the possibility that we could see some carry over from Wednesday's close. Then we got poor employment numbers followed by the action of the IEA. These two news items exaggerated the move down. I would guess it added 150-200 points to the down move as they supported the possible continuation of Wednesday's close.
Then during the day the shorter cycles kicked in and moved the market up. By 2:30-3:00 about half of the severe early sell off had been wiped out. Then shortly before 3:00 PM we got news that an agreement between the IMF-EU-Greece had been reached. This supported the short cycles up move and by the close most of the early day sell off had been eliminated.
News can and does affect cycles. In this case we saw the early market (that probably would have been down) down much more than one would reasonably expect. So the news supported the probable market cyclic action and we had a severe sell off. In the afternoon the IMF-EU-Greece news supported the push up by the shorter cycles and almost wiped out the early day sell down. Still it seemed to me we could see the effect of the cycles (especially between these news events as the shorter cycles pushed up). Yes, news can and does affect the cycles (depending on the news it may exaggerate or suppress the cycles). Today was a great example of news exaggerating the cyclic moves.
Tomorrow we have the shortest cycle - the 2.8TD cycle topping by midday. The 5.6TD cycle is up, The 11.2TD cycle is down. The 22TD cycle is up. So it seems in the early session we may have an up bias, but by afternoon it is down bias from the shorter cycles.
The 20week (Wall) cycle provides moderate down pressure. The 1 year cycle is down hard as it pushes toward a bottom in early July. So, in summary we may get a small rally early in the day followed by what could be a somewhat vigorous sell down in the afternoon. If course that assumes the PTBs don't pull more rabbits out of the hat.
Here is a visual using the SPY:

Wednesday, June 22, 2011
Comments and the outlook for 06-23-2011
Update 10:50 - got major bleed over from yesterday's close. Much more than I thought, but it is what it is. Long cycles definitely adding to the bottoming of the short cycles. Without a major reversal my outlook for a green close is not going to happen.
I told you yesterday: The sell down should start slowly (assuming no bad news out of Greece) and accelerate in the afternoon (that Benny and his press conferences - hehehe). Not a bad call. I was a little too pessimistic as we only took back about 60% of yesterday's gain.
Now tomorrow we may get some bleed over into the open as the two shortest cycles complete bottoming (a possibility worthy of consideration), But tomorrow the 5.6TD and 2.8TD cycles turn up by early in the session. The 22TD cycle is still up. The 11.2TD cycle is topping and turning down. So we have 3 of the shorter cycles up giving us an upward bias from the shorter cycles.
The 20 week (Wall) cycle provides moderate downside pressure. The 1 year cycle is down hard. So for the first part of the day the cycles should balance out (down a little, up a little) and be sideways. By afternoon the upside pressure from the shorter cycles should win. So I believe we should have moderate gains tomorrow (5-7 S&P points) mostly in the afternoon.
Here is a visual with the SPY:
![]() GL traders. Do your own analysis. Be careful.
GL traders. Do your own analysis. Be careful.
I told you yesterday: The sell down should start slowly (assuming no bad news out of Greece) and accelerate in the afternoon (that Benny and his press conferences - hehehe). Not a bad call. I was a little too pessimistic as we only took back about 60% of yesterday's gain.
Now tomorrow we may get some bleed over into the open as the two shortest cycles complete bottoming (a possibility worthy of consideration), But tomorrow the 5.6TD and 2.8TD cycles turn up by early in the session. The 22TD cycle is still up. The 11.2TD cycle is topping and turning down. So we have 3 of the shorter cycles up giving us an upward bias from the shorter cycles.
The 20 week (Wall) cycle provides moderate downside pressure. The 1 year cycle is down hard. So for the first part of the day the cycles should balance out (down a little, up a little) and be sideways. By afternoon the upside pressure from the shorter cycles should win. So I believe we should have moderate gains tomorrow (5-7 S&P points) mostly in the afternoon.
Here is a visual with the SPY:

Tuesday, June 21, 2011
Comments and outlook for 06-22-2011
Update 03:17 - looks like I was too pessimistic unless we get a sizable drop in the next 40 minutes or so.
Update 10:55 - fairly flat to down a little. Slow start if we are to get a selldown just as I expected.
Was light on my upside projection. Still I got the direction right and it closed near the day's highs as expected. So not a bad call over all.
Tomorrow the 5.8TD cycle and 2.8TD cycles should be down. They should be hard down into a bottom near the end of the day. The 11.2TD cycle is up and should be topping near the end of the day. The 22TD cycle remains up. So we have 2 shorter cycles down and two up. With the 2 shortest cycles down hard by the end of the day I believe the bias for the short cycles will be down tomorrow.
Also, the 20 week (Wall) cycle should contribute moderately to the downside and the 1 year cycle is hard down. Taken with the bias of the short cycles I expect tomorrow to give back most or all of today's gains. The sell down should start slowly (assuming no bad news out of Greece) and accelerate in the afternoon (that Benny and his press conferences - hehehe).
Here is a visual using the SPY:
![]() GL traders. Do your own analysis. I could be wrong. I know that is hard to believe, but it has happened before. Hehehehe
GL traders. Do your own analysis. I could be wrong. I know that is hard to believe, but it has happened before. Hehehehe
Update 10:55 - fairly flat to down a little. Slow start if we are to get a selldown just as I expected.
Was light on my upside projection. Still I got the direction right and it closed near the day's highs as expected. So not a bad call over all.
Tomorrow the 5.8TD cycle and 2.8TD cycles should be down. They should be hard down into a bottom near the end of the day. The 11.2TD cycle is up and should be topping near the end of the day. The 22TD cycle remains up. So we have 2 shorter cycles down and two up. With the 2 shortest cycles down hard by the end of the day I believe the bias for the short cycles will be down tomorrow.
Also, the 20 week (Wall) cycle should contribute moderately to the downside and the 1 year cycle is hard down. Taken with the bias of the short cycles I expect tomorrow to give back most or all of today's gains. The sell down should start slowly (assuming no bad news out of Greece) and accelerate in the afternoon (that Benny and his press conferences - hehehe).
Here is a visual using the SPY:

Monday, June 20, 2011
$hui - gold bug index 06-21-2011
Looks like $hui is up through the end of the month.
![]() GL traders, do your own analysis...
GL traders, do your own analysis...
Comments and outlook for 06-21-2011
Update 2:47 PM should be setting a top on the 2.8TD cycle now....
Update 11:55 Has exceeded my expected range, appears I was too conserative.
Update 09:40 We broke above the 1279-1280 resistance level as expected.
The day traded in a modest range and ended closer to the high than low of the day. We tested and slightly broke the 1278+ FIB. This is what I told you I expected to happen.
Tomorrow we are sitting near the 1278+ FIB and this is a resistance point. The 22TD and 11.2TD cycles continue up tomorrow. The 5.6TD cycle is down tomorrow, but the 2.8TD cycle has turned up. So we have 3 shorter term cycles up an one down. On balance the shorter cycles should provide some up side push.
The 20 week (Wall) cycle continues to provide some downside push. The 1 year cycle is still down hard. So we again have these two longer cycles offsetting much of the upside push of the shorter cycles. Can the market overcome the resistance at 1279-1280? I believe so, because it seems to me there is a slight advantage to the short cycle bias up tomorrow. Much as today any gain will be modest (5-7 S&P points?) and the trading range should be fairly narrow (1% or so). Again I expect we will end the day closer to the top of the range than the bottom...
Here is a view of the SPY and shorter cycles:
![]() GL traders. Do your own analysis and be careful - I expect this push up to end by/before the end of the week and for it to be modest.
GL traders. Do your own analysis and be careful - I expect this push up to end by/before the end of the week and for it to be modest.
Update 11:55 Has exceeded my expected range, appears I was too conserative.
Update 09:40 We broke above the 1279-1280 resistance level as expected.
The day traded in a modest range and ended closer to the high than low of the day. We tested and slightly broke the 1278+ FIB. This is what I told you I expected to happen.
Tomorrow we are sitting near the 1278+ FIB and this is a resistance point. The 22TD and 11.2TD cycles continue up tomorrow. The 5.6TD cycle is down tomorrow, but the 2.8TD cycle has turned up. So we have 3 shorter term cycles up an one down. On balance the shorter cycles should provide some up side push.
The 20 week (Wall) cycle continues to provide some downside push. The 1 year cycle is still down hard. So we again have these two longer cycles offsetting much of the upside push of the shorter cycles. Can the market overcome the resistance at 1279-1280? I believe so, because it seems to me there is a slight advantage to the short cycle bias up tomorrow. Much as today any gain will be modest (5-7 S&P points?) and the trading range should be fairly narrow (1% or so). Again I expect we will end the day closer to the top of the range than the bottom...
Here is a view of the SPY and shorter cycles:

Sunday, June 19, 2011
Comments and outlook for 06-20-2011
Update 06-20 02:25 Looks like we got a slight pullback where the 2.8TD cycle should have bottomed.
Update 06-20 12:15 Tested (an broke slightly) the 1278 FIB level on S&P. Do we now pull back some?
Friday's outlook was pretty much on target - a moderate gain. Even though the short cycles are up they are having limited success because the longer cycles are down. This situation continues early this week.
The 22TD, 11.2TD, and 5.6TD cycles are up on Monday. The 2.8TD cycle is down most of the day and bottoms late day. So the short cycles are aligned to provide some upside push. The 20 week (Wall) cycle is down providing some modest downside pressure. The 1 year cycle is hard down offsetting a lot of the upside from the shorter cycles.
Overall you have a battle between the short cycles pushing up and the longer cycles pushing down. In my opinion the shorter cycles hold a modest advantage at this time. So I expect the market will trade in a fairly narrow range and the S&P should end up 4-5 points. We probably will test the 1278 FIB during the day.
Here is a visual using the SPY:
![]() GL traders. Do your own analysis. Don't get greedy - the upside is limited.
GL traders. Do your own analysis. Don't get greedy - the upside is limited.
Update 06-20 12:15 Tested (an broke slightly) the 1278 FIB level on S&P. Do we now pull back some?
Friday's outlook was pretty much on target - a moderate gain. Even though the short cycles are up they are having limited success because the longer cycles are down. This situation continues early this week.
The 22TD, 11.2TD, and 5.6TD cycles are up on Monday. The 2.8TD cycle is down most of the day and bottoms late day. So the short cycles are aligned to provide some upside push. The 20 week (Wall) cycle is down providing some modest downside pressure. The 1 year cycle is hard down offsetting a lot of the upside from the shorter cycles.
Overall you have a battle between the short cycles pushing up and the longer cycles pushing down. In my opinion the shorter cycles hold a modest advantage at this time. So I expect the market will trade in a fairly narrow range and the S&P should end up 4-5 points. We probably will test the 1278 FIB during the day.
Here is a visual using the SPY:

Saturday, June 18, 2011
Comments and outlook for week of 06-20-2011
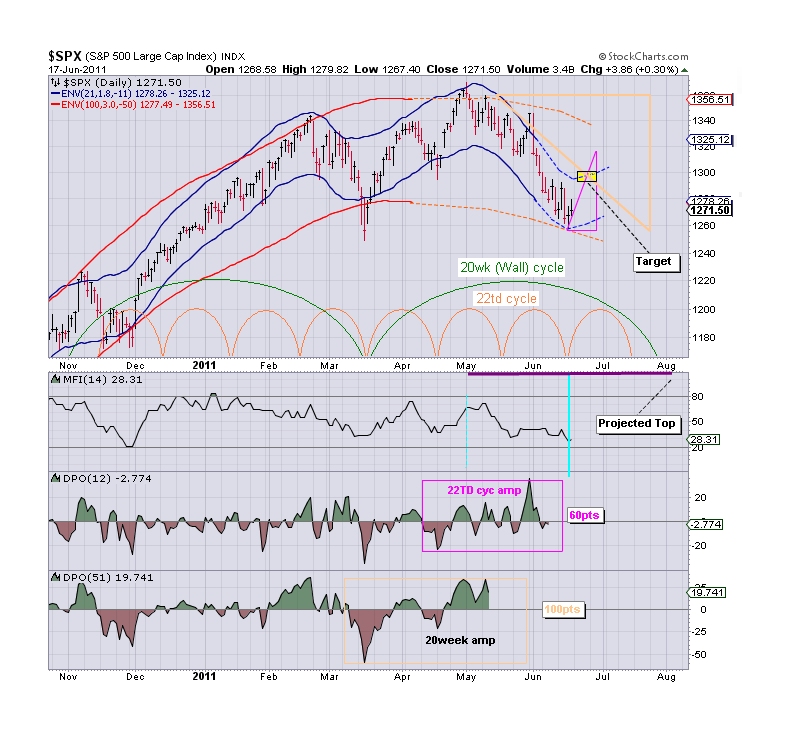
It appears we had the 22TD cycle (and shorter cycles) bottom mid week this past week. I was over pessimistic on the market low and where we would close the week. I think though I had a good call the market action overall.
So the 22TD cycle should be up next week. The 11.2TD cycle shout be up and top Thu. The 5.6 week cycle should top on Monday and be down Tue-Thur and up Fri. The 2.8TD cycle should bottom Monday, be up Tue and part of Wed, down second half of Wed and Thur, and up Fri. Overall the shorter cycles should provide some upside push.
The 20 week (Wall) cycle is down. The 1 year cycle is hard down. So we have the longer cycles offsetting the upside push by the longer cycles. Still the week probably will show some gains for the week, but those gains should be moderate. The first upside target is around 1295 FIB, then 1310 FIB. I believe we could break above 1295, but fall short of the 1310 target. The week will probably end near the high of the week.
Here is the FIBS:
![]() Here is the SPX (20 week and 2TD):
Here is the SPX (20 week and 2TD):
![]() For shorter cycles see 06-20-2011 outlook (to be posted later). GL traders. Do your own analysis. Use stops as appropriate.
For shorter cycles see 06-20-2011 outlook (to be posted later). GL traders. Do your own analysis. Use stops as appropriate.
So the 22TD cycle should be up next week. The 11.2TD cycle shout be up and top Thu. The 5.6 week cycle should top on Monday and be down Tue-Thur and up Fri. The 2.8TD cycle should bottom Monday, be up Tue and part of Wed, down second half of Wed and Thur, and up Fri. Overall the shorter cycles should provide some upside push.
The 20 week (Wall) cycle is down. The 1 year cycle is hard down. So we have the longer cycles offsetting the upside push by the longer cycles. Still the week probably will show some gains for the week, but those gains should be moderate. The first upside target is around 1295 FIB, then 1310 FIB. I believe we could break above 1295, but fall short of the 1310 target. The week will probably end near the high of the week.
Here is the FIBS:

Thursday, June 16, 2011
Charles Nenner on real estate 06-14-2011
A View of Real Estate Cycles with Insight from Charles Nenner
Tuesday June 14, 2011 - 13:40 PM EDT
http://finance.sfgate.com/hearst.sfgate/news/read?GUID=18723200
Tuesday June 14, 2011 - 13:40 PM EDT
http://finance.sfgate.com/hearst.sfgate/news/read?GUID=18723200
comments and outlook for 06-17-2011
I indicated yesterday I thought today would be flat to moderately higher. I guess it depends on which index you look at - DOW was moderately up, S&P flat, NAZ down. In total I think we would have to say flat. Today we touched the 1259 FIB. This well could be the low for now, and we could see a 2-3 day move up. I would not be surprised to see the market move to 1294 and possibly higher over the next 2-3 days. On the other hand with the longer cycles down (and the 1 year down hard) I won't be surprised if we don't. In summary we should see 2-3 green days, but moderate up movement. Tomorrow winds up OPEX so it might be a bit unstable (up and down).
The 22TD, 11.2TD, 5.6TD cycles should be up tomorrow. The 2.8TD cycle is up a part of the day and should top by the afternoon. The longer 20 week cycle is down but not at maximum momentum. The 1 year cycle is down and at maximum momentum. Over all this should lead to an up day tomorrow. I would expect maybe a 10 point gain on the S&P to near the 1279 FIB. It could be a close call as to whether we are up/down for the week.
Here is the SPY:
 GL traders. Do your own analysis. The bear is not gone, just taking a few days off.
The 22TD, 11.2TD, 5.6TD cycles should be up tomorrow. The 2.8TD cycle is up a part of the day and should top by the afternoon. The longer 20 week cycle is down but not at maximum momentum. The 1 year cycle is down and at maximum momentum. Over all this should lead to an up day tomorrow. I would expect maybe a 10 point gain on the S&P to near the 1279 FIB. It could be a close call as to whether we are up/down for the week.
Here is the SPY:

Wednesday, June 15, 2011
Comments and outlook for 06-16-2011
Somewhat surprised at the strength of the down side today. Still it was 22 days since the last bottom of the 22TD cycle (nested bottoms for 11.2TD, 5.6TD and 2.8TD cycles). Add to this the down pressure of the 20 week cycle and 1 year cycle which is hard down and it was not a total surprise. We set a new low today for this down leg.
Now if we refer to Gann we know the cycle is most likely 22.5TDs (1/4 x 90 = 22.5). This implies some weakness could bleed over into tomorrow morning. Maybe we still hit the 1159 FIB level? Overall though tomorrow should at least be flat an probably up. I would not expect a huge up day, but that may depend partially on how the news breaks out of Europe.
All the shorter cycles are up (or turn up during the day) tomorrow. Probably this leads to an up day even though we have longer cycles down. This push up likely continues 4-5 days into mid week next week. We will see, and adjust outlook if need be by the end of the week.
Here is the SPY:
 GL traders. May be a short term long trade here. I bought a couple of long positions today. Do your own analysis, be careful. NOTE: Had some comments about my projected rounded bottom - so maybe I was a bit early, all today did was shift that projection forward as we got no deep dip that would create a V bottom.
Now if we refer to Gann we know the cycle is most likely 22.5TDs (1/4 x 90 = 22.5). This implies some weakness could bleed over into tomorrow morning. Maybe we still hit the 1159 FIB level? Overall though tomorrow should at least be flat an probably up. I would not expect a huge up day, but that may depend partially on how the news breaks out of Europe.
All the shorter cycles are up (or turn up during the day) tomorrow. Probably this leads to an up day even though we have longer cycles down. This push up likely continues 4-5 days into mid week next week. We will see, and adjust outlook if need be by the end of the week.
Here is the SPY:

Tuesday, June 14, 2011
comments and outlook for 06-15-2011
Today I was 180 degrees off on the market action. Happens sometimes. That short 2.8TD cycle exhibited unexpected vigor (either that or I have misjudged the bottom timing and it happened Monday?).
I had expected a V shaped bottom to happen Wednesday. It now looks as if we may be putting in a rounded bottom (with a low point Monday?). So that leaves confusion as to exactly what to expect tomorrow. So I will go with the rounded bottom theory. That implies down during the day and a low higher than Monday's low and some recovery by the close.
Here is a SPY chart:
 GL traders. Be sure to consider alternative outcomes. The bear may be in hiding for now.
I had expected a V shaped bottom to happen Wednesday. It now looks as if we may be putting in a rounded bottom (with a low point Monday?). So that leaves confusion as to exactly what to expect tomorrow. So I will go with the rounded bottom theory. That implies down during the day and a low higher than Monday's low and some recovery by the close.
Here is a SPY chart:

Monday, June 13, 2011
What the cycle analysts are saying - part 2
Update June 13 2011: http://www.financialsense.com/contributors/clif-droke/the-five-stages-of-the-kress-cycle-tsunami
Original post Mar 29 2011
Tonight we look at another cycle analyst - Cliff Drokes.
Drokes generally (not that I have come across) does not focus on the shorter cycles that I would call "swing trade" cycles. Still he is a frequent contributor of online articles covering cycles. Drokes is a follower of the Kress cycles (named after Samuel Kress - member of the Kress family that founded Kmart and its predecessor).
Drokes says of the yearly cycles the ones of consequence are: the 2 year, the 6 year, the 10 year and 30 year. He claims all other cycles are derivatives of these cycles. For example the 4 year is really 2 of the 2 year cycles. Or the 60 year K-Wave is 2 of the 30 year cycles. Specifically he says "The other cycles can be chalked up to merely the products of the "Rule of Alternation" or to a composite of the four cycles under discussion.".
http://www.gold-eagle.com/gold_digest_08/droke021511.html
He says -
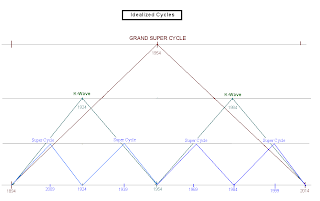
First let's look at the long cycles (idealized) projecting a bottom in 2014:
Next let's look at the less long cycles:
 I believe Drokes analysis is better suited to the investor who holds longer term whereas I look at shorter cycles better suited for the trader.
GL traders. I hope you find this information helpful.
Original post Mar 29 2011
Tonight we look at another cycle analyst - Cliff Drokes.
Drokes generally (not that I have come across) does not focus on the shorter cycles that I would call "swing trade" cycles. Still he is a frequent contributor of online articles covering cycles. Drokes is a follower of the Kress cycles (named after Samuel Kress - member of the Kress family that founded Kmart and its predecessor).
Drokes says of the yearly cycles the ones of consequence are: the 2 year, the 6 year, the 10 year and 30 year. He claims all other cycles are derivatives of these cycles. For example the 4 year is really 2 of the 2 year cycles. Or the 60 year K-Wave is 2 of the 30 year cycles. Specifically he says "The other cycles can be chalked up to merely the products of the "Rule of Alternation" or to a composite of the four cycles under discussion.".
http://www.gold-eagle.com/gold_digest_08/droke021511.html
He says -
- The 12 year cycle bottomed hard in 2002 (2 X 6 year cycles?). So I think we can assume a 6 year cycle topped in 2005 and bottomed in 2008, will top in 2011 and bottom in 2014.
- The 10 year cycle bottomed in 2004 (other analysts say 1982, 1992, 2002 were 10 year cycle bottoms). In that case it should top in 2009 and bottom in 2014.
- The 6 year cycle peaks later this year (implies a bottom in 2008 - [he says later 2008] and another bottom in 2014). See 12 year cycle above.
- As I recall Drokes claimed the 4 year cycle should bottom last Sept/Oct. Of course the 4 year cycle is really 2 X 2 year cycles - so we should see a 2 year top this fall around Sept/Oct and a bottom in Sept/Oct of 2012.
First let's look at the long cycles (idealized) projecting a bottom in 2014:

Next let's look at the less long cycles:

GL traders. I hope you find this information helpful.
Comments and outlook for 06-14-2011
Not exactly what I expected for today. Looked OK until around 1 pm when the 2.8TD cycle bottomed - then the bounce off that bottom was a lot stronger than I had anticipated. With the close near unchanged I suspect that the 2.8TD cycle is now spent to the upside....
So for tomorrow we have the 22TD, 11.2TD, and 5.6TD cycles are down. The 2.8TD cycle tops, but I suspect is spent. In addition to that the 20 week (Wall) cycle is down and the 1 year is hard down. So I expect tomorrow could be one of those hard down type days (1% + down on the S&P - test the 1159 FIB and possibly break below it?).
Here is the SPY chart:
 GL traders. BEAR CROSSING ahead - drive carefully. Do your own analysis.
So for tomorrow we have the 22TD, 11.2TD, and 5.6TD cycles are down. The 2.8TD cycle tops, but I suspect is spent. In addition to that the 20 week (Wall) cycle is down and the 1 year is hard down. So I expect tomorrow could be one of those hard down type days (1% + down on the S&P - test the 1159 FIB and possibly break below it?).
Here is the SPY chart:

Sunday, June 12, 2011
comments and outlook for 06-13-2011
My call for Friday was close. I think I covered to a large degree the outlook for Mon-Wed. Even posted my shorter cycle chart (which I will repeat).
There is a Fib # just under 1260 which I believe could be a target for Monday. I am expecting Monday to continue the pullback with much the same momentum as Friday. The 22TD and 11.2TD cycles are down. The 5.6TD cycle should top by Monday afternoon and turned down. The 2.8TD cycle should bottom around the same time and turn up. So let's say a net of 2 of 4 short cycles are down.
In addition the 1 year cycle should be hard down, and the 20 week (Wall cycle) is adding some minimum down side pressure. So overall the cycles are pushing down and a 10 point decline on the S&P would not be out of the question for the day. Any negative news could result in even more down side.
Here is the short cycles chart:
 Gl traders. Do your own analysis. Be careful the bear is still lurking.
There is a Fib # just under 1260 which I believe could be a target for Monday. I am expecting Monday to continue the pullback with much the same momentum as Friday. The 22TD and 11.2TD cycles are down. The 5.6TD cycle should top by Monday afternoon and turned down. The 2.8TD cycle should bottom around the same time and turn up. So let's say a net of 2 of 4 short cycles are down.
In addition the 1 year cycle should be hard down, and the 20 week (Wall cycle) is adding some minimum down side pressure. So overall the cycles are pushing down and a 10 point decline on the S&P would not be out of the question for the day. Any negative news could result in even more down side.
Here is the short cycles chart:

Saturday, June 11, 2011
FCEL 06-11-2011
Normally I do not feature stocks this cheap and/or without large volume, but some friends are looking at this stock. I will leave it up to you to do the fundamental analysis.
FCEL appears it just set a 11TD bottom. The amplitude of this cycle appears to be about $.40 ($.07 a day). At $1.39 that is an upside potential of $1.79 if this cycle were operating in a vacuum, but it isn't. There is a 33TD cycle that is down and it has an amplitude of about $.45 ( about $.03 a day). So that means the net potential the next 5-6 days is around $.04 a day or $.20-.24 to the upside (say around $1.60 +/- $.03).
Here is a chart:
 An ideal entry time for a longer term trade may be the last week of June. GL traders, do your own analysis.
FCEL appears it just set a 11TD bottom. The amplitude of this cycle appears to be about $.40 ($.07 a day). At $1.39 that is an upside potential of $1.79 if this cycle were operating in a vacuum, but it isn't. There is a 33TD cycle that is down and it has an amplitude of about $.45 ( about $.03 a day). So that means the net potential the next 5-6 days is around $.04 a day or $.20-.24 to the upside (say around $1.60 +/- $.03).
Here is a chart:

Friday, June 10, 2011
Comments and outlook for the week of 06-13-2011
Last weekend I told you for the past week the first target was the 1278 FIB and because of the 1 year cycle we could possible see a low 10-15 points lower. The low today was around 1270. So overall I believe my outlook for the week was on target.
The coming week the first downside target is around 1259.55 (FIB). The upside target would be around 1294.62 (FIB). The second downside target is around 1247.56 (FIB). I believe around 1250 is a prior low and a significant MA level. I have seen several calls for a test of 1250. Here is a FIB table:
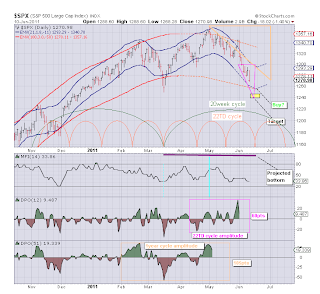
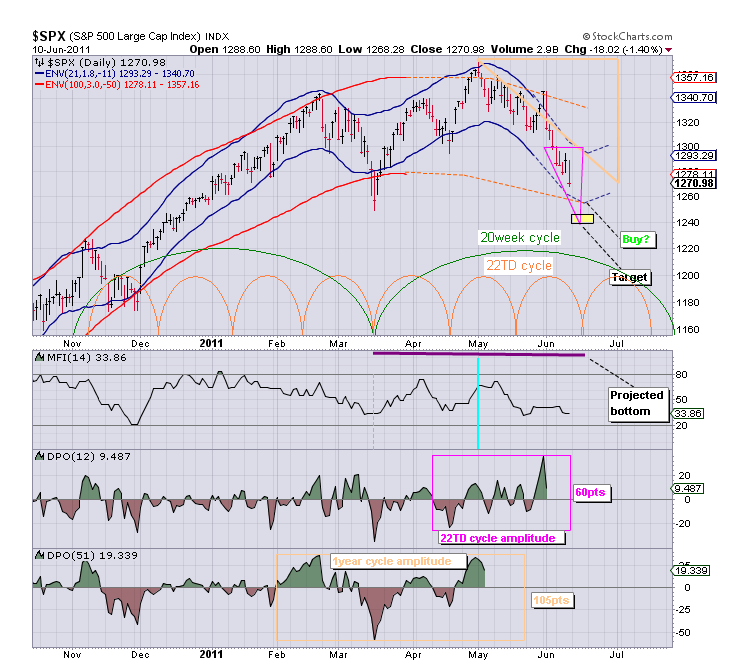
 I believe the first 3 days (Mon-Wed) will be down and at least one of those days could show a significant drop. So I believe we will test and break the first downside target around 1259. Based om my chart work It appears after applying the DPO for the 22TD cycle and the 20 week (Wall) cycle that the down side is the low 1250s or upper 1240s. This does not consider the effect of the 1 year cycle which is hard down and could add 10 or more points to the downside. So I believe it is possible that 1250 will be broken and possibly even the fib level at 1246.56 broken. Here is my chart showing the 22TD cycle and 20 week (Wall) cycle:
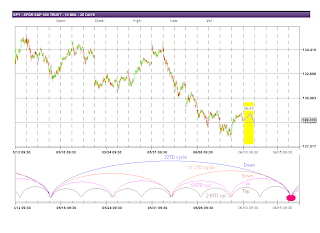
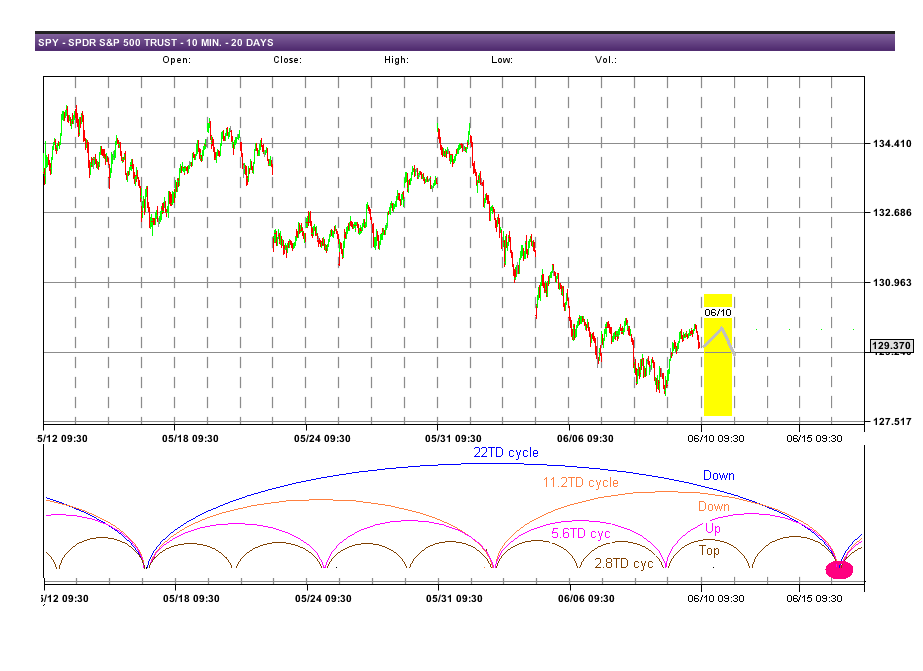
 As I mentioned - the first 3 days of the week should be down, but by the close Wednesday we should have multiple short cycles bottoming (22TD cycle, 11.2TD cycle, 5.6TD cycle, 2.8TD cycle). Once these short cycles bottom Wednesday there will probably be something of a move up. So the week should close somewhere in the middle of its range for the week (probably around 1260?). Here is a visual of those shorter cycles that bottom Wednesday:
 Finally, reference my prior post on Spiral dates and you will note they show a low for June 15. So we get a low by Wednesday close, and then a tradable move up that should last 3-4 days (more detail as the week proceeds).
GL traders, do you own analysis. The trend is down so going long can be risky. The bear is loose so be on guard.
The coming week the first downside target is around 1259.55 (FIB). The upside target would be around 1294.62 (FIB). The second downside target is around 1247.56 (FIB). I believe around 1250 is a prior low and a significant MA level. I have seen several calls for a test of 1250. Here is a FIB table:


GL traders, do you own analysis. The trend is down so going long can be risky. The bear is loose so be on guard.
Thursday, June 9, 2011
Comments and outlook for 06-10-2011
It is quite evident that my cycle positioning was less than perfect (off by about 4-5 trading hours) and a bottom was set near the close Wednesday. I think I have now made that adjustment. The expected pop I talked about started at the open (not 2-3pm) as I had supposed. And it did show a bit of vigor (a tradable pop).
This upside push may last into tomorrow morning. The 1 year, 20 week, 22TD and 11.2TD cycles are down. The 5.6 TD cycle is up. The 2.8TD cycle is up first part of the day but will top by mid day. Because the action of these 2 short cycles occur over a short span they probably will (may) move the market up a bit in the early part of the day. After that (after the 2.8TD tops) the longer cycles should take control and we should see a nice sell off in the last half of the day going into the weekend. I suspect we could close near the lows of the week (under 1280).
Here is a visual:
 GL traders. Do your own analysis. Remember this bear was only napping and may wake up tomorrow during the day hungry and grouchy,
This upside push may last into tomorrow morning. The 1 year, 20 week, 22TD and 11.2TD cycles are down. The 5.6 TD cycle is up. The 2.8TD cycle is up first part of the day but will top by mid day. Because the action of these 2 short cycles occur over a short span they probably will (may) move the market up a bit in the early part of the day. After that (after the 2.8TD tops) the longer cycles should take control and we should see a nice sell off in the last half of the day going into the weekend. I suspect we could close near the lows of the week (under 1280).
Here is a visual:
Wednesday, June 8, 2011
Comments and outlook for 06-09-2010
Today held up a little better than I expected. Still we broke the 1278 level I mentioned. So much as expected, but a little less downside than expected. The longer cycles (1 year hard down, 20 week down and 22TD down) seem to still be in control.
So what about tomorrow? The 11.2TD cycle tops by afternoon, but the 5.6TD cycle and 2.8TD cycle are bottoming. Overall it seems the shorter cycles should contribute to the downside bias for most of the day. These cycles should top and bottom and top by 2-3 pm.
So this is how I imagine the market behaves tomorrow. Weak open (maybe gap down) and down to around 2:30. With the longer cycles down and 2 shorter cycles down hard into a bottom we could get a sizable sell down before these cycles bottom. Then the last 1-1.5 hours the market recovers some lost ground. FWIW: this may be a tradable bottom (I'm talking 1-2 days - not a long term trade!!!).
Here is a visual:
 GL traders. Tomorrow afternoon the bear may decide to take a 1-2 day nap so be careful - this bear could awaken at any time. Hehehe. Do your own analysis
Update 11:18
My charts seem to be off by about 4 hours (second time this week I have had this thought). So I shifted then a bit. I believe this is a better representation:

So what about tomorrow? The 11.2TD cycle tops by afternoon, but the 5.6TD cycle and 2.8TD cycle are bottoming. Overall it seems the shorter cycles should contribute to the downside bias for most of the day. These cycles should top and bottom and top by 2-3 pm.
So this is how I imagine the market behaves tomorrow. Weak open (maybe gap down) and down to around 2:30. With the longer cycles down and 2 shorter cycles down hard into a bottom we could get a sizable sell down before these cycles bottom. Then the last 1-1.5 hours the market recovers some lost ground. FWIW: this may be a tradable bottom (I'm talking 1-2 days - not a long term trade!!!).
Here is a visual:

Update 11:18
My charts seem to be off by about 4 hours (second time this week I have had this thought). So I shifted then a bit. I believe this is a better representation:

Tuesday, June 7, 2011
comments and outlook for 06-08-2011
Not exactly the day I envisioned with the gap up at the open. The market then traded in a fairly narrow range until the last hour. By the time our buddy Ben started his press event the market was barely positive. By the time he finished it was red. So we got out attempt at a rally and it was fairly minor as I speculated any rally attempt would be.
By the close though it appears the longer cycles (1 year hard down, 20 week down and 22TD down) had again taken control. IMO this puts the bulls back on the defense. Given we closed at or near the lows we easily could get some weakness bleed over into the open tomorrow.
Looking at the short cycles (the longer cycles mentioned above are all down) - the 11.2TD day cycle is still up, the 5.6TD cycle is down, and the 2.8TD cycle tops mid day. So in trying to imagine how this is likely to play out I think a likely scenario is gap down at the open, spend 2-3 hours filling the gap and down the last half of the day. So I would expect a challenge and breaking of the 1278 level, but not a major sell down. Of course news could always lead to a bigger sell down than I expect.
Here is a visual:
 GL traders. Be careful there may be a bear in that tree outside your window. Hehehe
By the close though it appears the longer cycles (1 year hard down, 20 week down and 22TD down) had again taken control. IMO this puts the bulls back on the defense. Given we closed at or near the lows we easily could get some weakness bleed over into the open tomorrow.
Looking at the short cycles (the longer cycles mentioned above are all down) - the 11.2TD day cycle is still up, the 5.6TD cycle is down, and the 2.8TD cycle tops mid day. So in trying to imagine how this is likely to play out I think a likely scenario is gap down at the open, spend 2-3 hours filling the gap and down the last half of the day. So I would expect a challenge and breaking of the 1278 level, but not a major sell down. Of course news could always lead to a bigger sell down than I expect.
Here is a visual:

Monday, June 6, 2011
Comments and outlook for 06-07-2011
Today was much as posted/expected. We broke the 1294 level as I said I expected we would. We did not reach the next FIB level (as I said I doubted we would). It appears to me that the longer cycles are firmly in control of the market and moving it down. If I have it right the 1 year cycle will continue to push down through June. We probably get some rally attempts along the way.
I doubt that tomorrow will be a rally attempt. Remember we have the 1 year cycle hard down, the 20 week cycle down and the 22TD cycle down. We have the 11.2TD cycle up. The 5.6TD cycle should top mid day as the 2.8TD cycle bottoms. With this alignment of cycles I think we continue down tomorrow. There is a possibility of an attempt to rally mid day after the 2.8TD cycle bottoms, but it should be relatively minor. I believe during the day we will break below the 1278 level, but will not get to the next FIB level at 1259.
Here is a visual:
 Out of curiosity I took a look at a couple of EW sites. Seems they are now convinced the market is headed down. Thanks for the history lesson. I told you in mid April that we had a VIX trend change signal. About a week later the market topped and turned down. We have now been down 5+ weeks. I have been telling you for around 3 weeks that the 1 year cycle down leg should kick in and dominate by late May/early June. It appears that has happened. I have tried to give you an idea of what would probably happen, not give you a history lesson after the fact... Overall, I believe I have done fairly well in that respect. I won't get it right every day, but check out my record for yourself.
GL traders, Do your own analysis. The bears are on the prowl.
I doubt that tomorrow will be a rally attempt. Remember we have the 1 year cycle hard down, the 20 week cycle down and the 22TD cycle down. We have the 11.2TD cycle up. The 5.6TD cycle should top mid day as the 2.8TD cycle bottoms. With this alignment of cycles I think we continue down tomorrow. There is a possibility of an attempt to rally mid day after the 2.8TD cycle bottoms, but it should be relatively minor. I believe during the day we will break below the 1278 level, but will not get to the next FIB level at 1259.
Here is a visual:

GL traders, Do your own analysis. The bears are on the prowl.
Sunday, June 5, 2011
2011 and beyond - the outlook
Every few months I try to give you a longer term outlook based on what some longer term cycles are doing. I often refer to the 20 week (Wall) cycle. A Kitchin cycle encapsulates 9 Wall cycles (3.39 years or 40.68 months). If I have analyzed the situation correctly the 7th of the 9 Wall cycles is now topping. That means in around 50 weeks (let's say 1 year) from now we will be looking for a bottom in the Kitchin Cycle (the last bottom was near the March 2009 low).
No I am not going to talk about the Super Cycle (30 years), the K-Wave (60 years), or the Grand Super Cycle (120 years). Yes, those are supposedly coming in 3-4 years according to most cycle analysts, but we want to look at the setup as that time approaches for those cycles.
Now before the Kitchin Cycle bottoms there is another cycle that will bottom. Some time ago I posted about the PI cycle: http://swingcycles.blogspot.com/2010/10/2011-cyclic-environment-pi-cycle.html
You may want to read this before proceeding. Martin Armstrong discovered the PI cycle. He recently got out of jail (7 years for contempt!!! Then 5 years for some bogus charge by the CFTC) and is able to write again. He says 2011.45 (Jun 13-14) is an important date. The PI cycle topped with the 2007 top and should bottom in early 2012. Now if we accept the theory that the maximum down momentum for longer cycles is achieved in the last 12.5% (in this case about 6.5 months) of the down leg then that maximum down side for the PI cycle should start around mid June. Is this what Armstrong is referring to - 6.5 months of down side push? Google "Martin Armstrong cycle" and read his article for yourself.
So we have the PI Cycle reaching maximum down side momentum soon and pushing down into early 2012. This is followed by the Kitchin reaching maximum downside momentum by around March 2012. Finally there is a third longer cycle of interest - the 10 year cycle. This cycle last bottomed in late 2003 or early 2004. This means a bottom in late 2013 or early 2014. I would think given this that the 10 year cycle will reach maximum down side velocity sometime in late 2012 (maybe a little later?)...
I believe these cycles could lead to a sizable pullback and set the table for the extremely long term cycles that should start bottoming 2013-2015. We will take a look at these longer cycles at a later date, but if you are interested now there is a lot of information online (Google it).
Here is the visual of the 3 cycles discussed:
 GL - hope this makes the longer term outlook clearer.
No I am not going to talk about the Super Cycle (30 years), the K-Wave (60 years), or the Grand Super Cycle (120 years). Yes, those are supposedly coming in 3-4 years according to most cycle analysts, but we want to look at the setup as that time approaches for those cycles.
Now before the Kitchin Cycle bottoms there is another cycle that will bottom. Some time ago I posted about the PI cycle: http://swingcycles.blogspot.com/2010/10/2011-cyclic-environment-pi-cycle.html
You may want to read this before proceeding. Martin Armstrong discovered the PI cycle. He recently got out of jail (7 years for contempt!!! Then 5 years for some bogus charge by the CFTC) and is able to write again. He says 2011.45 (Jun 13-14) is an important date. The PI cycle topped with the 2007 top and should bottom in early 2012. Now if we accept the theory that the maximum down momentum for longer cycles is achieved in the last 12.5% (in this case about 6.5 months) of the down leg then that maximum down side for the PI cycle should start around mid June. Is this what Armstrong is referring to - 6.5 months of down side push? Google "Martin Armstrong cycle" and read his article for yourself.
So we have the PI Cycle reaching maximum down side momentum soon and pushing down into early 2012. This is followed by the Kitchin reaching maximum downside momentum by around March 2012. Finally there is a third longer cycle of interest - the 10 year cycle. This cycle last bottomed in late 2003 or early 2004. This means a bottom in late 2013 or early 2014. I would think given this that the 10 year cycle will reach maximum down side velocity sometime in late 2012 (maybe a little later?)...
I believe these cycles could lead to a sizable pullback and set the table for the extremely long term cycles that should start bottoming 2013-2015. We will take a look at these longer cycles at a later date, but if you are interested now there is a lot of information online (Google it).
Here is the visual of the 3 cycles discussed:

Saturday, June 4, 2011
Comments and outlook for 06-06-2011
Who would have guessed that the employment #s would have had the impact they did Friday? ADP told us and the NFIB (National Federation of Independent Business) confirmed that employment #s were going to be horrible. So it is not like the #s were a big surprise. So the negative market action confirms I believe that the longer cycles are now dominating market action.
Actually I thing the #s are understating the employment problem. Think about this: 10,000 boomers a day are hitting retirement age. Now I have seen no hard numbers, but among my circle it seems more and more people in the 62-66 age group are retiring at accelerating rates. Some because they can't find work. Some for health reasons. And then some like me who just got tired of the corporate rat race (of course I did that at 55 and have not regretted it for a minute hehehe). So this is 300,000 boomers a month (or 3.6 million a year) leaving the labor force. Let's say half of these retire within a year of being elgible or about 150,000 a month. You would think this alone would reduce the unemployment problem, yet the problem seems as bad as ever. Why is this not being reflected in employment (unemployment) #s?
But I digress. Monday the 11.2TD cycle and 5.6TD cycle are up. The 22TD cycle is down. The 2.6TD cycle is down. So overall these 4 shorter cycles offset (to a large extent). So the market action Monday is dependent on the longer cycles and the 20 week and 1 year cycles are down. And I believe the 1 year cycle is hard down.
Based on this alignment of cycles It would seem we should test and probably break below the 1294 FIB support level. Could we test the 1279 FIB support level? Maybe, but probably not Monday.
Here is a visual:
 GL traders. Extreme care is in order.
Actually I thing the #s are understating the employment problem. Think about this: 10,000 boomers a day are hitting retirement age. Now I have seen no hard numbers, but among my circle it seems more and more people in the 62-66 age group are retiring at accelerating rates. Some because they can't find work. Some for health reasons. And then some like me who just got tired of the corporate rat race (of course I did that at 55 and have not regretted it for a minute hehehe). So this is 300,000 boomers a month (or 3.6 million a year) leaving the labor force. Let's say half of these retire within a year of being elgible or about 150,000 a month. You would think this alone would reduce the unemployment problem, yet the problem seems as bad as ever. Why is this not being reflected in employment (unemployment) #s?
But I digress. Monday the 11.2TD cycle and 5.6TD cycle are up. The 22TD cycle is down. The 2.6TD cycle is down. So overall these 4 shorter cycles offset (to a large extent). So the market action Monday is dependent on the longer cycles and the 20 week and 1 year cycles are down. And I believe the 1 year cycle is hard down.
Based on this alignment of cycles It would seem we should test and probably break below the 1294 FIB support level. Could we test the 1279 FIB support level? Maybe, but probably not Monday.
Here is a visual:

Comments and outlook for the week of 06-06-2011
Before you proceed I suggest you review the outlook for June 2011. Overall the market trend is down, so this is not good for the coming week (weeks). The 1 year cycle is hard down. The 20 week (Wall) cycle has topped and is down for the next several weeks. The 22TD cycle has topped. Sure the 11.2TD cycle is up most of the week. The 5.2TD cycle is up into Tuesday. But, this is not enough to overcome the overall bias down of the cycles.
Based on the amplitude of the 20 week cycle and 22TD cycle (DPO) I have a target of around 1278 for the week. This does not consider the 1 year cycle which easily could add another 10-15 points to the downside (1263?). So 1278 (FIB 1278.94) is the first target for the week with 1263 as a possibility (FIB 1259.55).
Here is a FIB table:
 And here is a chart showing the 20week and 22TD cycles:
 GL traders. Do your own analysis. Be careful there are bears in those woods.
Based on the amplitude of the 20 week cycle and 22TD cycle (DPO) I have a target of around 1278 for the week. This does not consider the 1 year cycle which easily could add another 10-15 points to the downside (1263?). So 1278 (FIB 1278.94) is the first target for the week with 1263 as a possibility (FIB 1259.55).
Here is a FIB table:

Comments and outlook for month of June 2011
Back on April 11/12 I told you that the VIX had given a trend change signal. The market made one more high the next week and has been down the last 5 weeks. I consider that an excellent signal because it was early enough that you had time to position yourself for the change before the trend turned down.
During May I have been telling you that by late May (or early June) we should start to see the down leg of the 1 year cycle to start to really impact the market. That is because for longer cycles most of the downside of a down leg will occur in the last 15-20% of that leg. For a 1 year cycle the down leg should ideally be 26 weeks. And 15% of 26 weeks is 3.9 week and 20% is 5.2 weeks. Lets say 4-4.5 weeks which would be the month of June (as the 1 year cycle should bottom the first week of July).
To add to that the 20 week (Wall cycle) should have just topped and turned down. So don't be upset with me if I am somewhat bearish the next few weeks. Look at what happened this week. I think we are starting to see the impact of the 1 year cycle down leg, and if that is true then the next 4 weeks or so should be down. Actually, the first 2 weeks of July should also be weak as the Wall cycle bottoms in the middle to late July.
Will we get rally attempts? Probably, but any attempts to buy the dips should be done very carefully and for short term day trades. This is the type of environment where buying the dips can get your face ripped off by the bear.
So June should be a down month. The question is how much down. Using DPO (Detrending Price Oscillator) to gauge the amplitude of the 1 year and 20 week cycle I estimate we should be around 1150 by the end of June (and around 1100 by mid July). How does that match our FIBS? We have broken below the 1310.20 FIB and missed hitting the 1294 FIB by 2-3 points Friday. Longer term we have a FIB at 1146.06 and 1095.30 so I will assume at this time those are likely targets for end of June and mid July.
Here is the FIB table:
 And here is a cycle chart for the 1 year and 20 week cycles:
 GL traders. Do your own analysis. If you are a bull - in June be afraid, be very afraid.
During May I have been telling you that by late May (or early June) we should start to see the down leg of the 1 year cycle to start to really impact the market. That is because for longer cycles most of the downside of a down leg will occur in the last 15-20% of that leg. For a 1 year cycle the down leg should ideally be 26 weeks. And 15% of 26 weeks is 3.9 week and 20% is 5.2 weeks. Lets say 4-4.5 weeks which would be the month of June (as the 1 year cycle should bottom the first week of July).
To add to that the 20 week (Wall cycle) should have just topped and turned down. So don't be upset with me if I am somewhat bearish the next few weeks. Look at what happened this week. I think we are starting to see the impact of the 1 year cycle down leg, and if that is true then the next 4 weeks or so should be down. Actually, the first 2 weeks of July should also be weak as the Wall cycle bottoms in the middle to late July.
Will we get rally attempts? Probably, but any attempts to buy the dips should be done very carefully and for short term day trades. This is the type of environment where buying the dips can get your face ripped off by the bear.
So June should be a down month. The question is how much down. Using DPO (Detrending Price Oscillator) to gauge the amplitude of the 1 year and 20 week cycle I estimate we should be around 1150 by the end of June (and around 1100 by mid July). How does that match our FIBS? We have broken below the 1310.20 FIB and missed hitting the 1294 FIB by 2-3 points Friday. Longer term we have a FIB at 1146.06 and 1095.30 so I will assume at this time those are likely targets for end of June and mid July.
Here is the FIB table:
Thursday, June 2, 2011
comments and outlook for 06-03-2011
Looks like the market bottomed mid day as expected (where multiple bottoms nested). The market has followed the expected trajectory as explained last evening. I think I will give myself an "atta boy". Hehehee.
Now we all know tomorrow is employment data for the month of May. We also know given the ADP report Wednesday and the NFIB (National Federation Independent Businesses) said their member survey indicated little or no employment. So a bad report tomorrow should be baked in - no surprise and have little or no market impact. A large upside surprise might (but who trusts the govt #s anyway).
So we have had the 2.8TD, 5.6TD , and 11.2TD cycles bottom and turn up. The 22TD cycle topped and turned down. Still the weight of 3 up cycles vs 1 down cycle should give us an up day tomorrow. I expect 6-12 pts on the S&P - so a moderate up day.
Here is a visual:
 GL traders. Be careful (use stops) and do your own analysis.
Now we all know tomorrow is employment data for the month of May. We also know given the ADP report Wednesday and the NFIB (National Federation Independent Businesses) said their member survey indicated little or no employment. So a bad report tomorrow should be baked in - no surprise and have little or no market impact. A large upside surprise might (but who trusts the govt #s anyway).
So we have had the 2.8TD, 5.6TD , and 11.2TD cycles bottom and turn up. The 22TD cycle topped and turned down. Still the weight of 3 up cycles vs 1 down cycle should give us an up day tomorrow. I expect 6-12 pts on the S&P - so a moderate up day.
Here is a visual:

Wednesday, June 1, 2011
comments and outlook for 06-02-2011
An interesting day. I could go on about up vol vs down vol or advances vs declines and other technical issues, but most everyone else will do that - so I won't. If you look back at yesterday's projections I believe today most closely represented the projections I had for a 22TD cycle (vs a potential 34TD cycle). So for the time being it appears to me the 22TD cycle is still in play. I will continue to monitor for any change.
Assuming the 22TD cycle is in play we should see the 11.2TD, 5.8TD and 2.8TD cycles bottoming before noon. The 22TD cycle should top and turn down. Given this alignment of cycles the morning should be down (probably at least test 1310 FIB level). If we gap down at the open we may test the 1294 FIB level.
In the afternoon we should see a rally attempt off a late morning or mid day bottom. I suppose the open sets the tone for the day - if the market gaps down then we probably close down.
Here is a visual:
 GL traders. Do your own analysis
Assuming the 22TD cycle is in play we should see the 11.2TD, 5.8TD and 2.8TD cycles bottoming before noon. The 22TD cycle should top and turn down. Given this alignment of cycles the morning should be down (probably at least test 1310 FIB level). If we gap down at the open we may test the 1294 FIB level.
In the afternoon we should see a rally attempt off a late morning or mid day bottom. I suppose the open sets the tone for the day - if the market gaps down then we probably close down.
Here is a visual:

comments and outlook for 06-01-2011
I look at the data (history) and try to determine the probable outcome for today, tomorrow, next week and the month. So we aren't that different except my misses are out in the open for everyone to see. I would say if you are right 55-65% of the time on daily calls you are doing pretty good and if you are right over 65% of the time - you are smoking (and should follow your own projections). If you are right over 75% of the time - Warren watch out....
Of course judging what is a right/wrong call can be somewhat subjective too. If I tell you the market will be up in the morning and down in the afternoon and it is up in the morning and does not pull back - is that a right or wrong call? It is partially right, partially wrong. So when I am asked how often I am right I have a really hard time putting a number to it. I believe I am right over 50% of the time, but less than 65% of the time.
The point is no one is right all the time and you have to consider that when/if you decide to use their evaluations. So what will today bring us? As I pointed out last time we may be in a period where the 34TD cycle is emerging and the 22TD cycle (some refer to it as the lunar cycle) is fading. If the 22TD cycle is still relevant then it should top soon (new moon now). Maybe that explains yesterday's action?
On the other hand if the 34TD cycle is emerging it may be mid June before we top. I will show you both for your viewing:

 If we pull back the next 2 days I would think we go with the 22TD cycle. If we are transitioning to a 34TD cycle I would expect less of a pullback and then a reversal up by mid day tomorrow. I am leaning toward the 34TD cycle at this time. Either way we should see some pullback today.
GL traders, do your own analysis.
Of course judging what is a right/wrong call can be somewhat subjective too. If I tell you the market will be up in the morning and down in the afternoon and it is up in the morning and does not pull back - is that a right or wrong call? It is partially right, partially wrong. So when I am asked how often I am right I have a really hard time putting a number to it. I believe I am right over 50% of the time, but less than 65% of the time.
The point is no one is right all the time and you have to consider that when/if you decide to use their evaluations. So what will today bring us? As I pointed out last time we may be in a period where the 34TD cycle is emerging and the 22TD cycle (some refer to it as the lunar cycle) is fading. If the 22TD cycle is still relevant then it should top soon (new moon now). Maybe that explains yesterday's action?
On the other hand if the 34TD cycle is emerging it may be mid June before we top. I will show you both for your viewing:


GL traders, do your own analysis.
Subscribe to:
Posts (Atom)