Tuesday, November 30, 2010

12-01 cycle analysis S

It appears to me this stock should be avoided at this time.  A break below $3.68 is possible. Two cycles top within 3-4 days and this stock is near recent lows.  It has been making lower highs and lower lows.  This appears to be a high risk stock at this time....

See for yourself:

Monday, November 29, 2010

11-29 What does 2011 look like?

If we look at cycle alignment then 2011 should be simliar to 2001.  The exception being the period of 5-6 weeks following Sept 11, 2001.  This was a one time event that should not be repeated in September of 2011.  Of course there could be other events in 2011 that could affect this hypothesis.  Still I believe 2001 is the best template for 2011.  

The 10 year cycle bottomed in 2002 and should do the same in 2012.  Same relative position as in 2001 - check.  The 24 month (2 year cycle) is a factor of 10 (10/5 = 2) so it should have the same relative positioning in relationship to the 10 year cycle - check.  The 3.39 year cycle is about 1/3 of the 10 year cycle (3.33 years would be 1/3) so its alignment should be shifted .18 of a year ( 2.16 months or 64 days) forward from its bottoming relative to the 10 year cycle in 2002. From a purely rational view 2001 should be the best pattern match  (with the noted exceptions)  for 2011.

With this in mind I have  done a crude projection for 2011.   From late Jan to  mid Mar the 10 year, 3.39 year, 2 year, 1 year and 4 month cycles should all align down.  So the low for the year could be around the end of the third week of Mar (estimate 925 - may be too high).   The high for the year could be 3rd-4th week of Jan or mid May (estimate avg 1150).  The latter part of the year you have the 1 and 2 year cycles up.  This will offset (at least in part) the downside of the 10 year and 3.39 year cycles.  So I would expect the 4 month cycle to be relevant from Aug-Dec.

Warning: The following depiction is for visual representation of the above discussion  only and should not be relied upon for trading.

Friday, November 26, 2010

11-27 cycles updated for December

On Nov 13 I told you:

"As a dominant cycle reaches a top it exerts less effect as it starts to flatten out before turning down. This means less influence on the direction of the market. It also implies that the shorter cycles should exert more influence and a larger effect on market movement. So instead of day after day after day of the market moving up with a rare down day thrown in you get fewer up days and more down days. This makes for a better short term trading environment, but it also makes timing moves trickier. You get increased volatility both up and down.

As the topping process progresses you start to get more down days than up days. Just realize though the topping process for a longer cycles can be several days (2-3 weeks or more). In other words longer cycles have a longer turn radius than short cycles so we should not expect a sharp sell off the day after a long cycle tops, but a slow start that gains downside momentum over time."    Check.

Last week end I told you:

"So I expect the first part of the week to show some weakness (maybe test the 1173 area) and then a Thanksgiving rally to start. In other words the week should be choppy with little movement by the end of the week."    Check.

Mid week I told you:

"There may be a chance for a short term trade on the long side if we have the market opening down tomorrow morning. I view it as a fairly high risk trade and suggest if you take the trade you be careful and don't get greedy....."   Check.

I know, what am I going to do for you now!!!  I'll give it my best shot.  I believe we are in a confirmed down trend and next week will be choppy as we have one shorter cycle topping and 2 bottoming.    When the week is over I expect the week to be lower by Friday's close than the close this week (with a better than 50% chance we break below the recent 1173 lows during the week). 

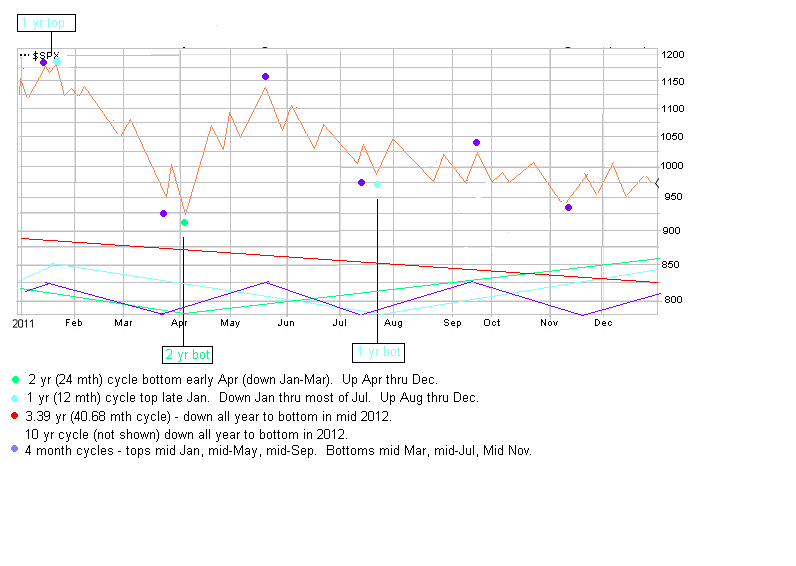
I also wanted to give you a longer view for the month of December.  The market will remain choppy with a downward bias the first 2 weeks of December.  The cycles align to the downside and we could get a more substantial sell down the second half of December.  The "selloff" that stole Christmas?

Here is the SPY (with my December projections):

Thursday, November 25, 2010

11-25 CREE revisited

With the sharp move up Wed we need to take a new  look at CREE.  It appears we have had 1 cycle topped and another ready to top.  You need to move stops up and may want to consider selling part of your position.  CREE could try and close the gap from August (another 5 ponts or so up), still you do not want to give back all your gains on that possibility...

Here is a current chart:

Wednesday, November 24, 2010

I am thankful to the people who helped make this blog better

You have offered suggestions for some stocks to analyze and offered feedback.  I am amazed at how well many of those picks have done.  I would suggest my readers/followers are better than most of the traders you encounter on the web.  I thank you for your suggestions as it makes me look like I know what  I am talking about.  You have been great.

Here are some stocks suggested by readers for analysis:  BUCY, CREE, CF.  All have done well or very well.   Also, I charted OIL for a reader interested in that commodity.  It has completed a complete cycle of buy, sell, buy which we documented.

So I am thankful for such well informed readers/traders and hope you will continue to help make this site relevant.   I encourage you to express  comments/opinions.

Tuesday, November 23, 2010

11-23 mid-week update

I told you over the week end I expected the first two days to be down.  The view for the remaining 1.5 days of the week is not real clear as we have 1 shorter cycle still to bottom and the 45 day cycle will top early next week.  There may be a chance for a short term trade on the long side if we have the market opening down tomorrow morning.  I view it as a fairly high risk trade and suggest if you take the trade you be careful and don't get greedy.....

Overall I still think Wed-Fri will be up, but given it is a holiday period trading it may be boring without a lot of movement on low vol.  The best advice may be to set stops and take Wed and Fri off.

Here is the SPY:


11-23 Looking back part III

I look back to see how I have done.  As I noted last time I looked back I don't always hit the ball.  I was too pessimistic on APPL and AMZN.  Since then APPL hit my revised target of $300.

I posted a chart of BUCY in late Oct and noted it was a buy.  This would have been a bases loaded home run.  I wish I could claim I saw a buyout coming.  I didn't.  BUCY analysis was requested by somone else.  Sometimes you get hit with dumb luck.  Still I saw it as a buy.

Another stock I covered was CREE after a pullback and noted it was a buy with an initial target of $54.  It has gotten over $58.  If I had revisited it a couple  weeks ago I feel confident I would have upped my target.  Regardless, I played calls 3 different times when CREE was in the $50-51 range for some nice profits.  If I had had the funds available I may have bought the stock.  But, between long and short positions I  did not have funds to do so.

It appears that CREE is near a top and if you own it then you should tighten your stops to preserve profits.  Here is CREE:

Have a great Thanksgiving.

Saturday, November 20, 2010

11-20 the week ahead

I told you last weekend:
 
"So this past week's move down may be reversed during the next week to a large extent (and possibly completely). I expect the first couple of days to remain weak as a couple of short cyces bottom and should turn up in the last half of the week. That implies the latter part of the week should show some upside potential."
 
Mid week I told you:

"We have had a very noticable sell down since the middle of last week, and so far no action indicating much of a bounce. But, after the past few days a bounce may be due."

I feel I was reasonably accurate for the week overall. Now I know I will not always be as accurate. I also know you expect me to try. So here goes. We should have a 5.5 day cycle top Monday before noon. We also have a couple of longer (but short term cycles) that should bottom early next week.

So I expect the first part of the week to show some weakness (maybe test the 1173 area) and then a Thanksgiving rally to start. In other words the week should be choppy with little movement by the end of the week.

Here is the SPX and 2 short cycles:

Hope all of you have a great Thanksgiving.

Wednesday, November 17, 2010

11-17 OIL cycles revisited

Called the last bottom in ETF OIL  (11/01).  So we took another look.  It appears it is ready to bottom in the next 1-2 days.  See for yourself: 

Update 10-18: CCI peeked above -100 triggering a CCI buy signal today.                                         

11-17 mid week cycle update

Based on market action the past 5 days I believe it is probable the 40.68 month cycle topped mid-week last week.  I was off by 5-6 days (so shoot me!!!).  We have had a very noticable sell down since the middle of last week, and so far no action indicating much of a bounce.  But, after the past few days a bounce may be due.

Then again it may be early next week before we get any bounce as that is when 2 shorter cycles bottom (22 day and 34 day cycles).  The 45 day cycle continues up to the end of the month.  If the 40.68 month cycle DID top then we now have 3 dominant long cycles (24 month, 40.68 month and 10 year) down.  The  one longer cycle that may provide some support is the 12 month cycle which should top around the third week of January.

IMO the sum of the cycles has now turned negative.  Time will tell.  Please do your own due diligence. Here is the SPY showing 3 of the shorter cycles:

For reference here are longer cycles mentioned above (previously posted):

https://blogger.googleusercontent.com/img/b/R29vZ2xl/AVvXsEheJWTQYU0yJd6vVLqFpkifekhK1_HF2xY_-9OTrm5XI2GXX0_Da8Axx9YWs2VPiz-tmETEw9Iy9BTuP8ZxIGYk6T_I2EzR1HiLdNdc9xyp1VkkPiK-egkghU6YLLBst4poYAI8uV-Nwyz0/s1600/1101-10yr-41-24mth.PNG

Tuesday, November 16, 2010

Cyclic analysis CF per request

CF is 2-3 days from the bottom of a 34 day cycle, but no buy signal yet.  There is a good chance we get signals at the bottom of this short term cycle (but not guaranteed).  I think the downside potential is $110, but it might be $108.  $108 would probably cause a channel buy signal.

Here is the short tem chart:
The longer term cycles are up, but the shorter of the two should top soon.  Here is the chart:


11-16 VIX trend change signal confirmed today

Since we first got a VIX trend change signal (closed below channel about a month ago) we had to wait for the Index (S&P) to confirm the signal.  We were waiting for 4 consecutive down days. Today was the first time we had 4 consecutive down days since the last signal.

Does this mean we go straight down.  No, it doesn't - but it should signal a period of time (several weeks or even months) of a down trending market as usually these signals are infrequent.

Interesting, that we are looking for the 40.68 month cycle to top in this time frame (Nov 19).  As I indicated in my weekend post though at the top that cycle would flatten and have reduced momentum.  So we may have already seen a top in the S&P.  Or, we may have one more push up toward recent highs. 

Here is the VIX/S&P as of market close today:


Sunday, November 14, 2010

Cycles - looking back part II

Not every call is going to be perfect.  When you are looking at an up trending marrket and the stocks that are leading the market up it is easy to over estimate the downside of any pullback.  I did that with AAPL.  Here is the chart from Oct showing my downside estimate of $290 (which was not achieved):

And for refernce here is a more current chart (and I may hve overestimated the downside again?):
And here is AMZN (another leader to the upside) - looks like I over estimated the downside potential in Oct:

And an updated chart (may be too bearish on AMZN again):

So, I won't always be right.  Still we need realize the leaders to the upside could lead to the downside if/when the trend changes and allow for that.

GL trading next week.

Friday, November 12, 2010

11-13 the week ahead as I see it


As a dominant cycle reaches a top it exerts less effect as it starts to flatten out before turning down. This means less influence on the direction of the market. It also implies that the shorter cycles should exert more influence and a larger effect on market movement. So instead of day after day after day of the market moving up with a rare down day thrown in you get fewer up days and more down days. This makes for a better short term trading environment, but it also makes timing moves trickier. You get increased volatility both up and down.

As the topping process progresses you start to get more down days than up days. Just realize though the topping process for a longer cycles can be several days (2-3 weeks or more). In other words longer cycles have a longer turn radius than short cycles so we should not expect a sharp sell off the day after a long cycle tops, but a slow start that gains downside momentum over time.

So this past week's move down may be reversed during the next week to a large extent (and possibly completely). I expect the first couple of days to remain weak as a couple of short cyces bottom and should turn up in the last half of the week. That implies the latter part of the week should show some upside potential.

As always this is the my opinion and should only be used in conjunction with your own analysis. Here is a chart showing two of the shorter cycles and how they play out next week.


UPDATE 11/15:  The http://www.chartsedge.com/ forecast looks reasonable this week (I omitted it last week because it did not look reasonable - and it wasn't)  IMO:

Defining a cycle

I think we can agree if we define a cycle as 90 days it should be 90 days  and expect it to be 90 days every time within 2-3 days.   It is not 90 days, then 60 days, then 90 days.  In other words the cycle should explain the data without altering the definition of the cycle length to explain the market movement. Not only that we should expect the cycle to have the up leg and down legs to be the same length (symetrical).

This is the correct way to define a cycle IMO.  Otherwise I can just alter things any way I want to explain the historical data.  That is not analysis, but the expression of a preconceived opinion of how the market should behave.  Others seem less rigid in their analysis:

Alice in Wonderland - 90 days is whatever I tell you it is.

http://www.safehaven.com/article/18911/90-day-cycle-looking-for-a-correction

Wednesday, November 10, 2010

11-10 CSCO cycle analysis

CSCO reported - earnings looked OK.  As usual Chambers provided very conserative/reserved guidance.  AH CSCO sold down.  So what do the next few days hold?  If we look to buy then when?  Hopefully cycle analysis will provide a clue.  Here is a chart with annotations:

Looks like a 10-15% correction but not over the cliff.

Tuesday, November 9, 2010

11-09 mid week cycles update

As we indicated on the weekend with the 5.5 day cycle turning down on Monday we might get a pullback.  We actually expected a green open Monday (didn't get that) and a pullback in the last half of the day.  So maybe the 5.5 day cycle will bottom by midday tomorrow.  In any case - it should bottom by the end of the day.  This will reduce down side pressure Thu/Fri.... 

Still the 22 day cycle and 34 day cycle will be down thru the end of the week.  The 45 day cycle is up.  So Thu/Fri should be a battle between the 5.5 day cycle plus the 45 day cycle and the 22 day cycle plus the 34 day cycle.  Uncertain which of the shorter cycles will  prevail - my guess is we end the last 2 days of the week without much progress up or down.  If there is a tie breaker it is the longer cycles (which are up) and we move up some the last 2 days of the week.

Here is the SPY (which I use as a market proxy):

Monday, November 8, 2010

Cycles - looking back Part I

Do cycles work?  That is a question you need to ask and answer for yourself.  Now at times I will miss or misinterpret something.  I have before and I will again.  If I have it wrong now you will know within the next month or two. 

Still, I have told you for now if you are a trader to buy the dips and sell the rips.  I have furnished charts showing this and at times showing the next potential dip (or rip).   So far that has been a winning strategy.

I have also posted charts of individual stocks that I was interested in or had a request to post.  Around Oct 21 I posted a chart on NUE showing it was about to bottom.  The lower channel lines I projected suggested a bottom around $37.  I believe the actual bottom was $37.02.  It the turned around and is now over $40.

Here is the chart I posted then:

So what about NUE now?  The evidence suggest it is topping and should turn down.  Here is the chart with annotations (sorry for the spelling on the chart):

We also posted charts on INTC around 10-22 and the cycles suggested a longer term cycle was up (and would continue up for a while).  Here are charts then and now:


In these 2 cases it looks like the cycles worked well.  I assure you that is not always the case (usually due to analyst error).
We will review other calls later in the week.

Sunday, November 7, 2010

Using the VIX for trend change signals

Many follow the VIX for potential trend changes.  Often they use Bollinger Bands (2 std deviations) to track extreme moves.  2 standard deviations is 95% move off a bottom or 47.5% off a top.  But using that alone tends to give false signals.

So I approach it a little differently.  I use MA envelopes with the envelopes 12% above and below the MA.  If the $VIX closes above the upper band then you have a potential trend change from down to up (remember the $VIX moves opposite the market).  For confirmation I want 4 consecutive up days.  If the $VIX closes below the lower band then you have a potential trend change from up to down.  Again we need confirmation - 4 consecutive down days.

We have had a close below the lower channel over 3 weeks ago, but are awaiting confirmation of 4 consecutive down days to declare a VIX signaled trend change to down.

See for yourself:


Saturday, November 6, 2010

11-07 cycles weekend update

Monday by around 12:00-1:00 pm we should have a 5.5 day cycle turn down.  This (along with one other shorter cycle down) may give us a pullback into Wednesday close.  I do not expect it to be more than a moderate pullback of 15 or so S&P points.  Here is a chart showing 2 short cycles:


Longer term we have a 40.68 month (3.39 yr) cycle set to top in 2 weeks around Nov 19.  This will lessen upside momentum and in December may even add to downside pressure.  In mid January we have a 1 year cycle topping and turning down.  We also have a 2 year cycle down into May.  So sideways to a bit up thru November, sideways to a bit down in December.  Then we get a sizeable downturn starting mid to late January which will last into early to mid May....  Here is a how it looks visually the next 2-3 months.


Wednesday, November 3, 2010

Individual stocks

I generally do not reccomend specific stocks.  I have charted a few based on requests (INTC, NUE, BUCY, OIL) and offered comments, but I assumed that the individuals requesting had done their own research and DD.

If you want specific ideas say for gold, silver, oil, biotech, and an occasional tech try KLIGUY's blog (see my blog list).  He has a large following that often make reccomendations in comments.  I cannot personally vouch for these reccomendations so you will need to do your own research.  I am sure there are many other sites that make specific reccomendations.

My goal is to try and keep you aware of the probable market trend so you trade with the trend not against it.  You will still need to come up with your own specific investment ideas generally.

11-3 mid week update cycles

Not much has changed since the weekend.  Sure we had an election.  Sure the Fed announced QE.  Yet, not much difference in the market.  The 5.5 day cycle (shown in my weekend post) should have bottomed today.  The 5.5 week (think 34 days) cycle is still down.   The 45 day cycle should have turned up. The 22 day cycle is up. 

Let's summarize:
  • 5.5 day cycle up
  • 22 day cycle up
  • 34 day cycle down
  • 45 day cycle up
So in total for the rest of the week the sum of the short cycles should be up.  Combined with longer cycles up we may see some sharp up moves Thu/Fri.  Time will tell.


Tuesday, November 2, 2010

What could change the trend/sentiment (cycle)?

I have done the analysis.  I have an opinion on what the market will do.  So I ask myself - what are the catalysts that will cause the market to change.  Cycles don't happen in a vaccuum. 

So here is a list of things we will (may) see in the next couple of months:
In my opinion none of these things are good for sentiment (market) and could lead to a change in the market trend (cycle top).

Feel free to add to the list under comments.  I am sure there are many I never though about.

Monday, November 1, 2010

Cycles - another's views

Here is a current article on cycles:  http://www.safehaven.com/article/18778/larger-uptrend-firm-into-2011-minor-top-set-for-mid-november

It differs from my analysis, but that is good in that it requires me to recheck my analysis.  Areas of disagreement are:
  • I do not view what he refers to as a 180 day wave (1 year cycle) as a dominate cycle
  • I believe his positioning of the 360 day wave (2 year cycle) is incorrect
  • His 4 year cycle leaves me wondering (the 4 year cycle is not dominant)
So here is his chart of the 4 year cycle with my comment:

Of course he could be right and I could be wrong - time will tell.  In his 180 day wave (1 year cycle) I believe his channels are overly generous and his projections high.  I have drawn in a tighter channel that I believe to be a better representation:


Here is my charts with annotations:


Note:  I have positioned the 2 year cycle differently.

You might ask why do I think the 1 year is not dominant?  Or the 4 year?  It is not just me that thinks that.  Check out this site: 

http://gann.su/book/eng/Daniel_Ferrera_Outlook_2010.pdf

Here is an excerpt of what he says:

"10-Yr, 41-Month & 24-Month CyclesAs discussed on pages 17-18 of the 2009 outlook, we cannot overlook the importance of the 10-year, 41-month and 24-month cycles when it comes to forecasting the general trend and direction of the stock market. The influence of these 3-cycles often predominates the entire trend when looking at 5-year sections of the market. There are of course other cyclic influences, but these 3 can never be ignored. The chart on the following page is very similar to the 100-year pattern shown (1909-1910) on the prior page and is also indicating a steadily declining market from Fall 2009 (Sept-Nov) into the season of Fall 2010 (Sept-Nov). Thus far, all indications are basically saying that the market is cyclically weak and both cycles and periodicity patterns indicate that the best buying opportunity for 2010 does not occur until very late in the season, most likely not until October or November.


Gann also stated that Bear markets often run 5 years down – the first move 2 years down (10/07 to 3/09), then 1 year up (2009), and 2 years down again (anticipating a Low in 2012), completing the 5-year downswing."

Now to wrap it up here is a projection based on the 24 month, 41 month (3.39 years) and 10 year cycles:


Now you have both views and can decide.