Thursday, March 31, 2011

Comments and outlook for 4-1

You have to be awed by the strength of the 33 day cycle.  I know I am.  Today was our best chance at a pullback and the best we could get was a mixed close (S&P and DJIA down, NAS up).  Well at least we saw some impact from the shorter cycles. 

Tomorrow morning may open down a smidgen, after that it should be up for the day as all the shorter cycles turn up.  I have no idea of exactly how strong a rally to expect, but I believe it could be 1% or more on the S&P.  I hope you found some stocks to buy today on weakness.  I made a couple of small purchases today.

See for yourself:

GL traders.  Do your own analysis.

Wednesday, March 30, 2011

What the cycle analysts are saying - part 3

Tonight we look at cycle analyst David Knox Barker.
 
http://www.safehaven.com/article/19583/global-stock-market-cycle-forecast-2011

Mr. Barker probably goes in to more detail about his analysis that the other analysts I have covered. He claims cycles can vary based on certain Fibonacci ratios (an illustrates this in his writings). One of the more interesting analysts I think. He also claims that government intervention extended the long wave (K-wave) cycle into 2012 - and it should have actually bottomed in 2009. He believes the current K-wave started in 1949 (or early 1950) and would have ended in 2009 or early 2010 (60 years) except for government intervention. A K-Wave is and made up of 2 Super cycles (same as Drokes).

He focuses on the Kitchin Cycle (he set it at 42 months - others use 41 months and 40.68 months (3.39 years) and some call it the Dewey cycle. He says there are 16 Kitchin cycles within a K-wave (8 within a Super cycle). The other cycle he focuses on is the 20 week cycle which he calls the Wall cycle (after PQ Wall explained the relationship between the 20 week cycle and the Kitchin cycle). There is 3 sets of 3 Wall cycles within each Kitchin Cycle. The rule of third last and weakest makes the third Wall cycle decline harder than the other two in the three sets and tends to show up clearly on a chart, which was what occurred on July 1, 2010

Let' summarize:

  • K-Wave (1949-2012)
  • Super cycle (1949-1981, 1981-2012 avg 31.5 years)
  • Kitchin cycle 42 Months (Mar 09 - Sep 12)
  • Wall cycle 20 weeks (pivot date July 1, 2010)
Here are the longer cycles:


And the Kitchin and wall cycles:

GL traders.  I hope you appreciate the similarities and differences of the analysts.  Next you will see how one analyst believes there are 3 Kitchin cycles in a 10 year cycle...    So be sure to read about the next analyst.

comments and outlook 03-31

Just no holding this 33 day cycle back.  Of course, I have been talking about the strength of this cycle for almost a week now. I thought maybe (just maybe) we would get a "real" pause today.  Didn't happen.

I see no reason to believe we get a pause tomorrow other than the shorter cycles being down.  But hat hasn't seemed to make a lot of difference lately.  If we are to get a decent pullback between now and the end of the first week in April - this is our best chance IMO.  We seemed to be getting a smidgen of a pullback at the close. Having said that we will probably go up and test the Feb 18 highs tomorrow.

Here is the view:

GL traders.  Do your own analysis.

Tuesday, March 29, 2011

Comments and outlook 03-30

As expected with the 11 day cycle down, the market was fairly flat.  Looks like the shortest cycle helped keep it green into the close.  Tomorrow it looks like all 3 cycles shorter than 33 days are down.  That implies an improved odds we finish lower (I'd say odds are 3-1 we are down tomorrow), but not a huge down day because of the strength of the 33 day cycle.

Here is the outlook:

GL traders.  Do your own analysis.

Monday, March 28, 2011

comments and outlook for 02-29

Today was the pause that refreshes.  Not really a surprise - hard to determine if it would be up a little, down a little or flat.  Most of the day it was up and sold the close.  Overall though the day was pretty much flat. 

This was the result of the 11 day cycle pushing hard to a bottom.  It should bottom tomorrow so I would not be surprised if we got a similar down tomorrow.  Of course, it could also be flat or up a little as the 11 day cycle pushes down and the 33 cycle day pushes up.  So I'm guessing - we get a 2 day pause before and then continue up thru the first week of April.

Here is a chart:

GL traders.  Do your own analysis.

What the cycle analysts are saying - part 1

Whqt are the cycles analysts saying?  I often look at what other cycle analysts have to say.  Sometimes I agree with them,  Other times, I agree with them only in part.   So I thought over the next few days I would provide you a summary of what some of these analysts say. 

The first one I want to look at is Jim Curry (Google him to find out his background and articles).  I looked at an article from February 22 this year and extracted information from his article.  

http://www.marketoracle.co.uk/Article26455.html

To summarize this is some of the highlights of the article:

I) The 45 trading cycle is in topping range, and is 21 days along (top Feb 23/24, 2011). The last low for the 45-day wave was the 1/20/11 bottom of 1271.26.

II) The 90 trading day cycle currently at 65 days along. The last bottom for the 90-day wave was the 11/16/10 low of 1173.00 on the SPX. Should bottom Mar 15, 2011?

III ) 180 day cycle (trading days) - 9 months (~ 40 weeks or 2 X Wall cycle of 20 weeks). It is 161 days from last bottom. 180 days should be March 21 (bottom). The last bottom was July 2010 at 1010.91

IV) The larger 360-day component, which is currently looking to peak at some point around the Summer of 2011 Averages 270 trading days - Note: He switched from trading days to calendar days to describe this cycle. As I interpret this cycle it tops in January and bottoms in early July.

V) The 4-year cycle is currently seen as 494 days (trading days) along from the 03/06/09 low of 666.79. This cycle should top March 2011 and bottom again in March 2013.


Conclusions:

The 45 day cycle is the nominal 10 week cycle (50 trading days). The 90 day cycle is sometimes referred to by Curry as 18-20 week cycle (the 20 week Wall cycle or 100 trading days).

Here is my interpretation of his cycles:


As you can see there is a lot of similarity to some of my interpretations, but  some differences.  His 90 day cycle is my Wall cycle (100 trading days).  He interprets the shorter cycle as 45 days (usually I use 33 days).   See the above URL for his chart versions.

Gl traders.  The more you know the better prepared you are to interpret my postings and make your own decisions.

Sunday, March 27, 2011

Cycles vs TTheory Money Flow

You will find the TTheory site in the my list of sites.  Parker Binion has recently written a series of articles about Money Flow as it relates to TTheory.  This week he presented a chart projecting a high in late May early June.....  After an exchange with Parker here is my understanding of this.  Where you get a divergence between Money Flow (down) and price (up) as shown by the red diagonal lines you look for a pivot and this pivot will mark a Middle point.   Looking at the black horizonal lines (left to right) you have the low point, middle point and high point.  The high point is projected for late May (early June).  At least this is my understanding after an exchange with Parker.  Reference the TTheory site for Parker's version of this chart.

Based on my work and projections - this seemed to be just the opposite of my expectations.  So I reproduced Parker's charts and added my own annotations.  Here is that chart:

It is going to be interesting to see which proves to be right - TTheory Money Flow or standard cycle analysis.   We have come to exact opposite conclusions.  Time will tell.  I think it is important to bring you opposing opinions when they are well founded so you have as much data as possible to supplement your own analysis.

GL traders.
  

Saturday, March 26, 2011

HL and MMR 03-26

As you might expect these two have similar chart patterns.  If I had to choose I probably would go with HL.  They both appear to be in an up cycle until around April 11-13 ( I would think they are still reasonable buys at current levels - HL has pulled back a little more and may be the better buy at this time).

Take a look:

GL traders.  Do your own analysis.

Outllook for April, 2nd qtr and 2011

Next week we start an new month and new quarter.  I think we did fairly well in getting the 1st  quarter right (turned negative about the 2nd week of February - a couple of weeks early).  Recently turned positive as we got a VIX trend change signal (which was supported by the cycles).

For the month of April I expect we see strength and upside through the first full week of April.  After that I expect another pullback to last through the end of April.  This pullback should set lows that are lower than in March.  As inflation (oil prices?) continue at high levels it will affect input and transportation costs to many firms.  They probably cannot pass on all these costs.  That will lead to margin pressure in April and the quarter.  So I expect earnings for the first quarter will be decent, but the outlook cloudy.  And the outlooks will impact stock prices.

Looked at Fibonacci pivot projections and they seem to support this outlook for the quarter:  Here are those projections:

See the 03-28 week projection  for a chart showing April.

Looks like we get a Fib projection of a pivot on 04/18.  But, it seems these projections have been off by about a week all year - so I am guessing this one will be also and we top around 04/11.  The next pivot projection is for 07/15 (bottom?).  Again I suspect this is off by about a week, but it implies we are bottoming as the quarter ends.

Finally a chart showing the outlook for the remainder of the year.  This chart is somewhat dated as it was created at the beginning of the year, but so far it has been spot on and is worth a look:

GL traders.  Do your own analysis.

The week ahead 03-28

The 33 day cycle dominated last week.  I expect that to continue next week as that cycle is up for another 10 or so trading days.  Of course you have the Wall cycle (20 weeks) down so that limits the upside somewhat.  You may have some limitations from a shorter cycle (the 11 say cycle down.  Still the 33 day cycle is dominating as it did in the sell off earlier in the month.

Based on this - I would expect the market to be up for the week.  I believe we could achieve 1330  (S&P) on the upside during the week.  Possible a bit more the following week (1335-1340).  I am doubtful about new S&P highs because the Wall cycle is down now whereas it was up when we achieved the old highs.

Here is a visual outlook:

GL traders.  Do your own analysis
I will try and provide an outlook for the month of April later.

Friday, March 25, 2011

pivot dates 2011

Cycle pivot dates are approximate, but should be within 1-2 days of actual pivot. 
Bradley pivot dates added for reference (+/- 4 days) and are not directional.


NOTE:   There are other cycles,  for example the 1 year cycle which should have topped early January and should bottom early July.

GL traders.  This information is for reference only, and you should evaluate the accuracy before making trading decisions.  Do your own analysis

Thursday, March 24, 2011

VIX Poll comments

Did we get a VIX signal at or near the top?  Yes/No.  Tough crowd - 75% said NO.  I would have voted YES.  There is not necessarily a right or wrong answer.  If you said we needed 4 consecutive down days then the answer would have been NO. 

A couple of points:
  • There is no time restrictions on how long it takes the VIX to move to an extreme down/up as I interpret it.  It could take several months or a few days.  Doesn't matter.  (It is my signal - I get to define the parameters).
  • Normally 3 consecutive up/down days is enough to confirm a signal.  In case of mixed closes (for example DJIA and S&P500 up and NASDAQ down) I would like to see 4 consecutive days.
We did set an extreme low on February 8 from a high back in late August (time is not a factor).  Then we got 3 down days Feb 21-23 (confirmation).  That was the start of the sell down.... 

Take a look:

Now I know this is not your standard VIX signal interpretation, but it is my own version which I developed in 2007  (after several attempts at developing a reliable signal based on the VIX) and back tested over several years.  It will not always signal a trend change, but when it does it normally is worth paying attention. 

Now a trend change can be short (2-3 weeks) or long (several months).  So you want to use this with other tools as it may not always signal a trend change....  As I stated in a comment to a poster my cycle work leads me to believe this trend change will last into mid-April.  Given the pullback on the VIX we may get a setup for another signal soon (VIX below 16.25 is a key area to trigger the signal, then we would wait for confirmation).

Hope this helps i n your understanding of this and how I use it.

comments and 03-25 outlook

Time to take a pause and re-evaluate.  The short cycles are having little impact.  It seems the 33TD cycle is dominant and pushing up hard.  It is about 11 trading days to the top of this cycle.  So we may get some flat to slightly down days over the next 2 weeks, but based on current market action it appears we push higher.  Do we test old highs?  That is definitely possible.

Take a look at how this cycle dominated on the downside and then imagine a mirror image to the upside.  I believe that is close to what we can expect.

Here is a projection of that time period:

GL traders.  Do your own analysis.

Wednesday, March 23, 2011

comments and 03-24 outlook

The short cycle made itself felt the first part of the day, but the longer cycles won the battle at the end of the day.  I want to give a "shout out" to JennaSue - nice call on S&P 1300.  So I was only partially right on the day.

Tomorrow we get the 11 day cycle topping before midday and turning down.   The 5.6 day cycle continues down tomorrow.   The 2.8 days cycle is down also.  It would seem tomorrow should be down - and we may get a move bigger than today.  Time will tell.

Here is the picture for tomorrow:

GL traders - do your own analysis.  As I told you in my weekend outlook - buy the dips and sell the rips, but be careful and use limit orders to buy, and trailing stops to protect from losses.

Update:  Time to step back and look at the bigger picture.  The shorter cycles are having little impact and the 33 day cycle seems to be dominating (pretty much as it did on the way down).    So I think we can assume an up bias for about 2 weeks (which would dovetail with the VIX trend change).  At best the shorter cycles seem to give us sideways action with minor dips.

bby 04-23

Unimpressive chart, no play I see.

GL traders.  Do your own analysis.

agu 03-23

Appears AGU put in a bottom and is now in an up cycle.

GL traders.  Do your own analysis

Tuesday, March 22, 2011

comments and outlook 03-23

Well, we finally got a day without a gap at the open.  I told you in my weekend outlook post I expected less volatility.  Sure didn't expect this much less.  Yesterday I opined that the bias from the totality of the cycles would be up.  It wasn't.  I think the lesson is that the cycles are in balance and the up pressure is offset by the down pressure (hence the decreased volatility).

Looks like tomorrow should start out with a little down pressure as the 2 shorter cycles (5.65TD cycle and 2.8TD cycle) are down all or most of the day.  So I expect a downward bias, but not a big move down.  The Money flow (MFI) seems to be in balance also (cash out/in).

Here is a picture:


GL traders.  Plan a midday nap - it could be a slow day.  As always do your own analysis and be careful. 

Monday, March 21, 2011

Comments and outlook 03-22

Well another day of  "guess the open" .  If you discount the open  my comments about today being flat seem on target.  Now I am not a fan of conspiracies - but this "guess the open" makes one think.  What has it been  - 7 or 8 days we have gapped up or down on the open.    I don't believe I have ever seen the markets behave in this manner for this many days in a row.  So WTF is going on?  Maybe someone learned they can gap the market using futures from the "flash crash" experience and they are setting positions before the close and during the night hours are using the futures market to cash out profitably at the open?  Or maybe the FED or some other party is using futures to control the market direction buying futures contracts before the open?  I don't know - but this is very strange market behavior.  Just wondering .....

At the close we were green.  This is the third consecutive day up.  Last week I mentioned the VIX had made an extreme high and if we got 3-4 consecutive up days that should confirm a trend change.  So IMO we have met those conditions and we have had a trend change signal to UP.   Now this signal does not tell us how long this change will last.  We know the VIX has pulled back substantially since the high last week over 31.  So a 47.5% move down  (to around 16.25) would be needed to set us up for a new trend change signal.  The VIX is currently about 4 points above this.  My work with cycles leads me to believe this trend change could last at least 4-5 weeks (into late April).


What about tomorrow?  The 33TD (trading days) cycle is up tomorrow.  The 11+TD cycle is up tomorrow. The 5.65TD cycle is down tomorrow.  The 2.8TD cycle is up until around 1pm tomorrow.  In total the shorter cycles should give us an upward bias tomorrow.

Of the longer cycles the Wall Cycle (20 weeks or 100TDs) is down.  The 1 year cycle is down and far enough past its top it may have some effect.  The other longer cycles that are down have not had time since topping to have much impact (yet).  Overall, I would opine the overall bias tomorrow should be up. 

Here is a chart:


GL traders.  Do your own analysis and use care.

Silver watch 03-12 Update I

It appears silver has reached an intermediate top and pivoted to the downside.  Should bottom in the first half of Apr.  Here is the picture:

GL traders, do your own analysis....

Update 03-21 7:41pm EDT

"The spread between the March, May and July contracts for all practical purposes is zero with the March and May trading even. I would watch out if March goes to a premium to the May contract as that would portend that there are issues related to the delivery process which are bullish for the market. Such a development would indicate that the longs are getting ready to squeeze the shorts."

http://traderdannorcini.blogspot.com/2011/03/still-watching-silver-deliveries.html

watching the VIX

Many watch for extreme moves in the VIX to try an pinpoint tops and bottoms.  IMO it is not that simple.  They use envelopes:

http://stockcharts.com/def/servlet/Favorites.CServlet?obj=ID2393449&cmd=show[s175637869]&disp=P

Note: I would have time shifted the envelope if it were my chart.

Or, Bollinger Bands:

http://stockcharts.com/def/servlet/Favorites.CServlet?obj=ID2393449&cmd=show[s179178685]&disp=P

Others use VIX VXV ratios (Google VIX VXV signals).

The concept is extreme moves in the VIX can help in spotting tops or bottoms.  Not that complex a concept.  But you don't need envelopes or Bollinger bands to spot extremes.  Any teacher knows about the Bell Curve and how in a normal distribution  2 standard deviations covers either side of the midpoint  about 47.5% of the population (or 95% on both sides of the midpoint).  This is how teachers grade on a curve (figures break points for a grade).  See for yourself: 

So we apply the Bell Curve as a teacher would to a grade (sort of).  Say the VIX is at 15 (a bottom).  95% of 15 is 14.25 - so a move to 29.25 (15 + 14.25) would be an extreme move up.  If the VIX were at 30 (a top) we would use 47.5% of 30 (14.25 points).  A move down from 30 to 15.75 would be an extreme move off the top....

We have just encountered such an extreme move (03/16).  See for yourself:

Now the VIX normally moves inverse to the market (it goes up when the market goes down and it goes down when the market goes up).  So an extreme move up suggests an extreme move down in the market (So we are now on alert for a bottom).

But this alone is not enough to call it a bottom.  We need confirmation of some sort.  I Suggest the best confirmation is market action.   Research suggests to me we need 3-4 consecutive up days to confirm we bottomed and a trend reversal is taking place.

We use mirror image logic for a trend reversal down.  NOTE  - this methodology will not call all reversals, so you will use it in conjunction with other tools, but it is reliable when it does give a signal.

UPDATE 03-21 04:30pm EDT - we got 3 consecutive up days to confirm our VIX signal.  That means the trend should now be up.

On AT&T news a quick look at S

Is it time to nibble?


Sunday, March 20, 2011

Romancing the GOOG - 03-21 Update II

It appears GOOG is at/near a bottom and should  be in an uptrend that should last through the first week of May.

Here is the specifics:

Gl traders.  Do your own analysis, be careful.

Update 10:54am EDT - the GOOG had a strong "pop" this morning, so I am guessing we were at a bottom.

Here is the longer term chart:


GL

Update II:  -7:00pm EDT

 "Now this is really exciting both the RTTTrendStatus and Hurst cycle show that the pullback is just normal within a bullish market trend"

http://www.safehaven.com/article/20347/is-it-time-to-buy-google

Saturday, March 19, 2011

FXA (Aussie $) Update II

The outlook (I know zero about currencies):


GL, do your own analysis

Update 1: Here is the US dollar:


Update II: US 10 yeat treasuries:


US$ vs gold:

comments and outlook 03-21

Last week's outlook was nothing to be proud of.  With the news whipsawing the market  - it seems every night while the market was closed  (or data releases in the morning) had the market gap  down or up.   Not all market movement is cycle related (some is news driven like this past week) - so such moves are outside of what the cycles are able to project.

I believe the 1 year cycle has now moved far enough past its top that it is starting to have some effect on the market.  The other two longer cycles (Kitchin and 4 year) still need some time to gather down side momentum and start having any substantial impact.

Here is a chart showing these longer cycles:


The medium length cycles (Wall cycle - 20 weeks ~ 100 trading days, 33 day cycle ) are moving counter each other.  The Wall cycle is down, and the 33TD cycle turned up mid-week.   The Wall cycle is far enough along in its down trend I expect it to have a bit more impact than the 33 day cycle.  So a slight down bias from these two cycles?

The 11 day cycle should have bottomed and be up.  So the combination of these 3 cycles is neutral to a slight up bias.  Here are the medium length cycles:

So we have the long cycles with a down bias, the medium cycles with an up bias.  Hard to say whether the overall bias is up or down from these cycles.  This only leaves the short cycles. The 5.5+ day cycle is up into Wednesday.  The 2.8 day cycle is down most of Monday, up Tuesday into Wednesday, and down the latter part of Wednesday and Thursday.   So we are flattish Monday, up Tuesday, turn down middle of Wednesday and down Thursday and close the week on Friday up.   Given this scenario I expect less volatility (if the news co-operates) and a range of 1265-1290 (+/- 5 pts either way). 

Here is the shorter cycles:

GL traders, looks like it is a buy the dips - sell the rips type of week.  Do your own analysis.  Use limit buy orders to get in at good prices and trailing stops to try and preserve any profits.

Friday, March 18, 2011

Nenner 03-10-2011

“I told my clients and pension funds and big firms and hedge funds to almost go out of the market, almost totally out of the market,” said Nenner, saying that the collapse will unfold over the course of a couple of months and that the reversal will come when the Dow hits just above the 13000 level."

http://www.infowars.com/ex-goldman-sachs-analyst-%e2%80%9cmajor-war%e2%80%9d-coming-end-of-2012/

Thursday, March 17, 2011

comments and outlook 03-18

Another day where the open determined the outcome for the day.  No news during the day to move the market to extremes during the day.  This "guess the open" pattern is getting tedious.  Still, I got the hoped for pop and bought some inverses (1/3 position - saving powder in case we pop again tomorrow). If you discount the open the pattern during th day was much as expected based on the cycles.

So will we get news over night that affects the open.  It is possible considering there are events in the Mid East an Japan that could break during the night.  And let's not totally forget the PIIGS and Europe.  As I post the UN is voting on action/inaction in regards to Libya.   Sounds like a resolution was adopted to take action against Libya.   Nothing will happen for some time on this - so it is probably not a factor.  There is also supposed to be a Group of Seven conference (call) regarding Japan and the Yen and whether to take coordinated action.  This could be a factor tomorrow.

All I can do is show you how the cycles should play out.  You are on your own in evalaluating these external factors and how they will affect the open.  Tomorrow we have the 11+day cycle topping as the 5.5+ day cycle bottoms around midday.  I would think these 2 cycles offset throughout the day.    The 30 day cycle is up and so is the 2.8 day cycle.  So this should provide support for the market and we possibly will see some advance in the market tomorrow (after any news is absorbed at the open).

Here is the cycle view for tomorrow:

GL traders.  Do your own analysis.  Do not over commit to a position and be ready to reverse field if news goes against you.

Wednesday, March 16, 2011

natural gas 03-17

Lots of chatter about natural gas (Japan).  So to be relevant here is a natural gas company.  Short term looks like it has 7-8 trading days to a top. 

GL traders.  Do your own analysis

ag watch 03-03 (update 3 - 03-16)

I had a position in RJA last week, and it did not move as soon as expected so I exited the position (very small profit) just as it was ready to make its move.  Another bus missed.  So RJA has had a nice move up and may have a bit more upside left, before a pullback (possibly starting next week).

Here is the current situation:

GL traders.  Do your own analysis.  You will notice I miss a lot of buses - the good thing about buses - there will be another along shortly.  lol

UPDATE - 03-09  RJA has been steadily falling all week.  By end of the week (if it continues) it will be in an area of interest (around $11).  This one is worth watching IMO.

Update 03-11  Took a closer look at RJA.  See some worrisome things (looks like a major top - double tops).  Next bottom projection is in early April.  So I would say AVOID being long for the next 3 weeks or so.  Here is the chart:

GL traders, do your own analysis

02-16 some infor for your consideration:

http://www.safehaven.com/article/20303/agri-food-thoughts

Comments and outlook 03-17

Another interesting day.  I told you over the weekend that news may override cycles.  Well, we saw it again today.  It wasn't even current news.  Evidently the EU energy minister said last night that the situation in Japan was out of control.  Duh!!!  You knew that, but when it hit the wires during the day (as if it were new news) the market dropped like a stone.  It made a couple of feeble attempts to rally, but the damage had been done and the day closed down.  So I will repeat:  NEWS CAN OVERRIDE THE CYCLES.  Until the situation with the nuclear plants in Japan is resolved (successfully we hope)  the market will be on edge and drop at the slightest excuse.

Still, I get a sense something more is going on.  My guess is that the longer cycles are starting to build some down side momentum.  If that is the case it could be a long spring/summer for the bulls.  I will be on watch for more clues of this.  If you see/read anything relevant, please share it.

We start the day with the two shorter cycles down, so we may get a test of today's lows in the morning.  They bottom during the day giving us 4 shorter cycles up by the end of the day.  So I would expect some recovery later in the day.

Here is the picture:

GL traders.  If you have longs left in your portfolio your stops were a lot looser than mine.  Also, my inverses are almost all gone from my portfolio.  So I am hoping for a "pop" sometime tomorrow to reload my inverses.

Tuesday, March 15, 2011

AAPL 03-15

Appears APPL may have made a double top (forming an "M" pattern?).  Looking at two shorter cycles a 14 day cycle should be bottoming and turn up for 7 trading days. A 56 day cycle should top around Apr 4.  I would not be surprised if APPL makes a lower high Apr 4 (following the :M" pattern) as it appears an even longer cycle may have turned down.

Here is a picture:


GL traders, do your own analysis.

03-16 long term charts

Looking at the longer term it appears that the best case scenario is a range from $300-360.  Not sure though it can maintain that range to the downside.

Here is the chart:

GL traders

comments and outlook 03-16

Pretty amazing market action today.  As I indicated in my early morning update the market needed to reset for the news out of Japan.  What is amazing is how quickly that reset happened.  We were down almost 300 DOW points very early in the session.  By 10:00 am EDT the market had found a bottom.  After that it moved steadily up all day exactly as expected from the shorter cycles (30 days or less) and indicated in my original post.

So does tomorrow continue the move up. Maybe, unless we get more bad news out of Japan.  It is not as clear a picture as today from the cycles.  The two shorter cycles (5.5 and 2.8 days) are down tomorrow.  So are many of the longer cycles (down).  The 30 day cycle and 11 day cycle are up.  So it is a close call tomorrow as to whether we make upside progress.  I am inclined to think we make some upside progress, but will not be surprised if we don't.  So I guess you could call tomorrow more sideways than up or down.  The open may determine whether we close up or down (guess the open?).

See for yourself:

GL traders.  Do your own analysis.

Monday, March 14, 2011

Comments and 03-15 outlook

I told you in my weekly outlook Monday would probably start to the downside and then turn up.  That is what happened.  The turn up was later in the day than I would have predicted if I had tried to put a time on the bottom.  I said a lower range of 1290 would be hit (we got somewhat lower).  Overall though I was correct (down and then turn up) on the market action even if off a bit on the specifics.

I expect tomorrow to continue the up turn that started around 2pm EDT today.  The 30 day and 11 day cycles are up.  The 5.5 day and 2.8 day cycles are up.  So the shorter cycles will control the market action tomorrow I believe.  The longer cycles are turning down, but the turn radius is fairly long and they do not yet control market action.  I would expect the market to close at least 6-8 S&P points higher than today's close.

Take a look:


GL traders.  Do your own analysis, this is one person's opinion.

7:01 am EDT - with the news out of Japan of dangerous levels of radiation leakage  you can forget the shorter cycles as the market resets.  Like after 911 it will take some time for the market to reset.  Where will it reset - it depends on how bad the situation gets in Japan as the market is now fear driven.

Saturday, March 12, 2011

the week ahead 03-14

Last week I told you that the market would trade the top of a 1295-1335 range on Mon/Tue and the bottom of the range Thu/Fri (Wed was a transition day).  The market  broke slightly below 1295 and never quite reached 1335.  Not a bad call - pretty much as the week played out.

I usually don't comment much about news and current events.  I leave that to people much better versed than I am to do that.  But, given all the news this weekend about the catastrophe in Japan I feel comments are justified.  This could get much worse if there is a nuclear reactor melt down.  There is no way to predict the total impact at this time.  We do know that the losses are going to be tremendous in life and property.

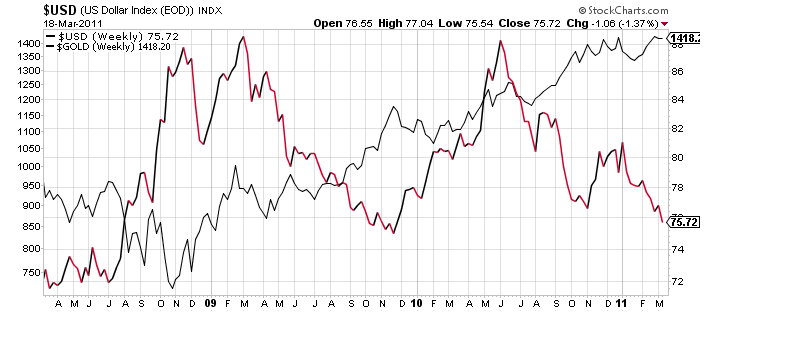
So who is going to pay for those losses?  In many cases it will be insurers and re-insurers.  So where will the get the money to pay for these losses?  Well - insurers set up reserve funds so they can pay in cases like this.  Those reserves to a large degree are invested in fixed rate investments.  Think government securities.  To pay claims these insurers will have to liquidate these investments.    This means additional supply of these assets will hit the markets over the next several months.  Not only that - these insures will not be buying at government bond auctions.

Not only that Japan is one of the largest holder/buyers of US Treasuries - second only to China.  Now I can imagine Japan may need to also raise tens of billions (maybe hundreds of billions) of cash as they have to invest large sums in repairing their infrastructure. Note:  China just announced a trade deficit and they may not be in the market as much as in the recent past.  

Suppose the US Treasury held a bond auction and no one showed up.   Does the Fed step in and buy the bonds?   Or, does interest rates increase to attract buyers? Probably some of both.  In short it seems to me that the Fed may well lose control and be unable to maintain interest rates near zero.  Not that the won't try - think QE3 super sized.

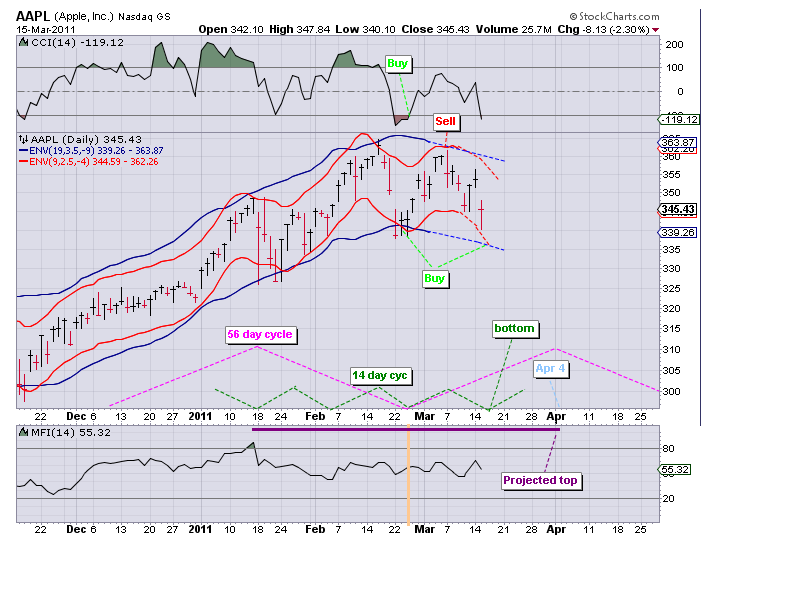
Now all this is not going to happen Monday (or even next week), but over a period of months.   How does this align with the long term cycles (1-4 years)?  I thought you would never ask.   It is spooky and almost as if these cycles anticipated something like this.  Didn't we just have the 4 year cycle top this past week (2nd anniversary of the March 2009 low)?  That is the claim of some as I blogged last week.  We had the 1 year cycle top in mid-January.  We had the Kitchin cycle top in February (41 month cycle).  Take a look:


Now I am not saying we get an instant market crash because of what happened in Japan.  But, when you are talking about the world's third largest economy - it will have an impact which I believe could be substantial over the next several months.  I would not be surprised to see some sell down Monday morning though as the scope of this catastrophe becomes clearer.

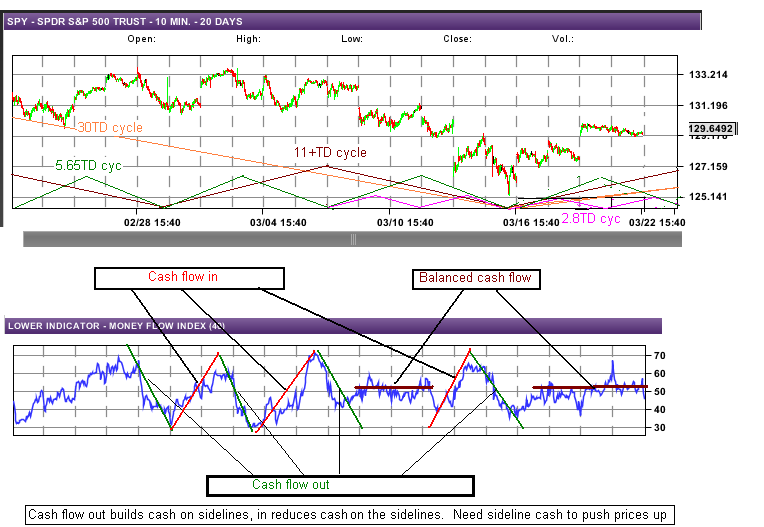
So what does the shorter cycles say about next week?  We have an 11td cycle turning up and up for the week.  We also have a 30td cycle that is set to turn up . The Wall cycle is down (may be what I have labeled as a 90td cycle?).  So this combination of shorter cycles suggest an up week (as I suggested we may start the week with a down open).  So let's say a range of 1290-1330 next week - starting near the bottom of the range on Monday and advancing throughout the week.  We may continue to have volatility through the week with 10 or more point swings on the S&P.

See for yourself:

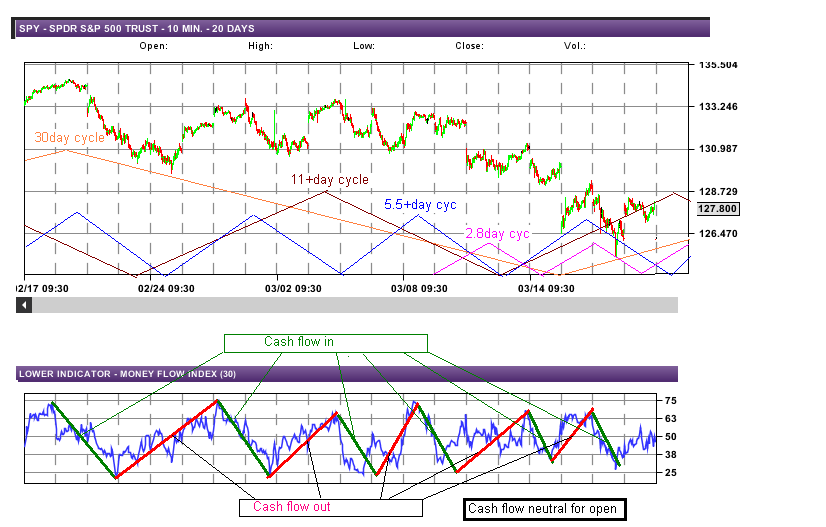
Finally what does Monday look like?  Let's look at the short cycles. The 5.5td cycle turned up Friday and will be up the first couple of days of the week. The 2.8 day cycle will be down most of the day.   These cycles will offset to a large extent Monday. So the 11td and 30td cycles will largely control the action on Monday.  So Monday should be an up day.  Here are the shorter cycles:


GL traders.  These are volatile times so be sure your stops are in place.  A nuclear melt down in Japan could override these shorter cycles and their market impact, so it is imperative you have stops and keep a close eye on the market next week.  You may have to turn on a dime.
 

Thursday, March 10, 2011

Comments and outlook for 03-11

Quite a day.  As I posted last night I expected the longer of the short cycles to push down.  Maybe a little more push than I expected (broke lower range I had mentioned of 1295 by a smidgen).  The 2 longer of the short cycles continue down tomorrow and should bottom sometime Monday....  I expect though a lot of the downward momentum has been expended and we have the 5.75 day and 2.8 day cycles up tomorrow.

So, I expect tomorrow could be down, but less so than today - much more of a sideways move.  Of course as always overnight news or intraday news (day of rage in Saudi Arabia tomorrow?) could make the bias tilt down more or less than anticipated.  Supposedly no FED POMO activity tomorrow (but I wouldn't bet the farm on that either as I believe the FED will do whatever they need to do to keep this sell down controlled).   We will see tomorrow.

Here is the cycle view:

GL traders.  do your own analysis.  Use stops and limits to achieve your trading objectives.
PS: Pay attention to cash accumulation comments on the chart.....

Update 05:15 AM EST - 8.9 earthquake in Japan.  Not sure of the impact on US markets, but it should add to the downside bias here.  Not much the FED can do about acts of God.  Nature 1 - FED 0.

Wednesday, March 9, 2011

Comments and mid-week update 03-10

So far the week has been much as projected in my weekend projection for the week.  Could I be wrong about Thu/Fri being weakish.  Of course I could.  We are still range trading as I speculated we would do. 

I believe Wednesday may well have been a transitional day.  I have reviewed charts and see no reason to change my outlook for the next 2 days.  While it is true we may have a couple of shorter cycles turning up the longer of the shorter cycles are down.  Now a couple of these cycles should make a fairly strong push down as they bottom.  So I expect in the next 2 days we could/will trade in the bottom part of the range of 1295-1335.

I have tried to include all relevant cycles on tonight's chart.  See for yourself:

GL traders.  Do your own analysis. Protect yourself with stops.

06:35 AM EST update - Asia markets and European markets were/are down.  The futures are well below Fair Value.  I suppose job numbers could change this, but right now it looks to be a very "red" open.

comments and outlook 03-09

In my weekly outlook I suggested that Mon/Tue would trade in the upper half of the range. Except for the dip into the lower half of the range Monday afternoon that has proven to be much the case.  Right now (6:30 EST) the futures are fairly flat (DOW and S&P above fair value, NAZ below fair value).  I expect today to be a transition day and then a couple of days in the lower half of the trading range (1295-1310).  Time will tell. 

I see nothing in the shorter cycles at this time to alter that outlook.  See for yourself:

GL traders.  Do your own analysis.  Don't forget your stops.