Tuesday, January 22, 2013

Time to go inverse?

Unlike the sites that charge a fee I rarely reccomend specific positions, but try to give you a more general market outlook.  That outlook can be used to buy long or short (inverse) index ETFS like IWM (Russell long) or RWM (Russell short).  Of course you can trade less broad indexes like S&Ps or DJIA using ETFs. 

I generally hold some Russell inverse (RWM) as a hedge against long positions.  I don't hold the shares passively but usually write calls after an 8-10% up move.  The last calls I wrote in late December just expired worthless.  Even with the proceeds from the calls I still have a small loss on  my RWM positions as I wait for a pop to write more calls.

It appears to me that the maket should top this week. So I believe you should consider taking some profits or alternatively buy some inverses like RWM to hedge your gains if you wish to maintain your holdings.  No one knows exactly when but sooner or later there will be another 40-50% sell down like the early 2000s or like 2008-2009 and inverses will soar.  Many analysts believe that could start in 2013.  History tells us that the average length of a bull run is about 4 years.  2009+ 4 is 2013. Or, history tells us that the 2 years after a presidential election tends to lag...

With this in mind I looked more closely at the RWM chart.  Here is the results:


GL traders

Saturday, January 19, 2013

Jan 21, 2013 silver update

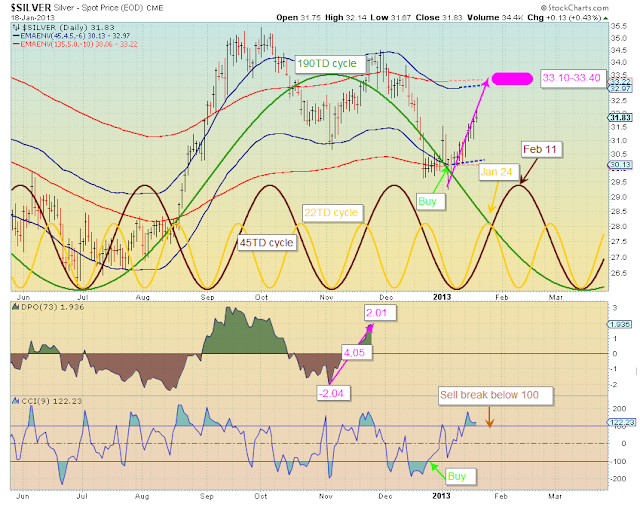
According to my charts you get a high in silver  around Jan 24 and another high  two weeks later around Feb 11. The high Jan 24 should be abut $32.30-32.40.  The high Feb 11 should be about $1 higher ($33.30).  You might want to take partial profits Jan 24?

Here is a visual:

Gl traders

Jan 2013 update III

New 5 year highs. It appears we still have a bit more upside next week with a topping around Jan 25 of the Wall cycle.  My projections are 1498-1510 for the SPX.  Then the Wall Cycle is down for 10 weeks through the first week of April. Within that 10 weeks we have the 25TD (qtr Wall) and 34TD cycle (1/3 Wall) cycles topping and bottoming providing opportunities to swing trade long and short.

Here is a visual:


Gl traders

Thursday, January 17, 2013

2013 outlook - Geomagnetic and Bradley

Thr following chart of expected solar (geomagnetic) activity correlates well with cycle projections with a high in June and a pullback into September.


Looking at the Bradley turn dates and highs lows they correlate with cycle predictions up to around the end of August:


Compare with my last update for 2013 (chart below) and Curry's 2013 predictions.


Wednesday, January 16, 2013

2013 - Jim Curry cycle outlook

http://www.safehaven.com/article/28428/us-stock-index-cyclical-forecast-for-2013

90 Day cycle (what I classify as the Wall cycle); 180 day cycle (7 x 24 + 12) or 7.5 month cycle or half a 1/3 Kitchin cycle; etc

Saturday, January 12, 2013

Silver update II

Appears silver should see some upside the next couple of weeks.  My estimates is about 6% or so (see target on chart).

GL

January 2013 update II

The placement of cycles is never exact or easy to do.  Sometimes it seems more an art than a science.  When evaluating the Kitchin, 1/3 Kitchin, Wall, quarter Wall, etc we know there should be sync of bottoms and tops.  Within the Kitchin cycle we have the 1/3  Kitchin putting in 3 bottoms and the 3rd bottom should sync with the Kitchin bottom. 

There are 9 Wall cycles in a Kitchin cycle, and 3 Wall cycles in a 1/3 Kitchin cycle, so the 3rd, 6th, and 9th Wall cycles sync with the 1/3 Kitchin cycle bottoms (these bottoms should be more pronounced).  The 9th bottom syncs with the Kitchin bottom.  Given this (all else being equal) we would expect the 9th Wall bottom (aligned with the 3rd 1/3 Kitchin bottom and and the Kitchin cycle bottom) to be the most pronounced downturn.

Expectations are not always fulfilled by reality.  The bottom in November should have been the Kitchin Cycle, 3rd 1/3 Kitchin Cycle and 9th Wall Cycle bottoms but was less robust to the downside than expected.  This led me to question if this was the actual Kitchin Cycle bottom.  Timewise it was already somewhat extended as early September whould have been 42 months from early March 2009 (now that was a bottom!!!).  Since then the market action/data seems to confirm the bottom in November was the Kitchin Cycle bottom.  Time will tell.

This interpretation leads to differing tops and bottoms placement in January.  Here are visuals of the cycles leading up to January:


Here are the shorter swing cycles:


GL

Update Jan 16 - expect short 8+ day cycle today (close up last hour?):


Sunday, January 6, 2013

silver update I

SILVER Jan 5 2013
If you were agile enough there was a 5-6% trade this past week in silver.  Looks like another chance to get into silver at a good price should present itself this coming week.

Saturday, January 5, 2013

January 2013 update I (added info Jan 8)

Looks like the 22TD cycle (22-25 trading days long) topped out and is now down until mid-January.  The 34TD cycle (33-35 trading days long) continues down until around Jan 17-18.

I was surprised at the strength of the market Monday and Wednesday this past week.  I had expected the 34TD cycle to dampen the upside of the 22TD cycle (which it did until Monday - and then the 22TD cycle popped like a tightly wound spring).  But the 22TD cycle and 34TD cycle should now be in sync and the result should be a sizable sell down next week....

Here is a visual:
GL traders.

Update Jan 7:

SPX:VIX ratio at extreme highs (usually means sell).
Short term cycle (about 8 days - 10 minute chart):

Charles Nenner - Jan 2013

Charles sees a short-term buy signal in the stock market which should last into February. He also expects a rally by mid-January in the bond market, which should be used to get out of all bond funds. Charles believes the long term bull market in bonds is over and investors can expect rising yields in the future.