Monday, December 28, 2015

2016 Yearly outlook

Bradley based cycles:

Wall cycles:

Note that the nested bottoms match the major turning points (bottoms?) of the Bradley cycles while the top July 1 (Bradley chart) matches the top of the nine month cycle.  Also, may see some longer cycles bottoming (Kitchin,  Juglar) in early 2016....

Matching charts arrived at using different methods increases confidence in results.

Time will tell.... Looking for other projection charts.  If you see other chart projections I would like to see them so add a comment with a URL.


Thursday, December 24, 2015

Dec 28,2015 weekly outlook

Did not get any downside until last trading day of the week last week.  I had expected more downside to start Tuesday or Wednesday.  Looks like down into the new year (last minute tax selling?)


Happy New Year's


GL traders


Short term trade (updated Dec 29 after close)

Dec 31 11:30 am  - out for the year:


Friday, December 18, 2015

Dec 21, 2015 weekly outlook

Expecting another down week into Christmas.  Seems Santa forgot to get a flu shot and is under the weather and finding it hard to rally.  May even have to call second string Santa to come in as a substitute!!!!


Merry Christmas

GL traders

Update 1:


Traded this one multiple times in December.....

Update 2:
Shorter time span trade signals:


Wednesday, December 16, 2015

Dec 17, economic production

Economic cycles and stock cycles differ.  Normally an economic cycle will precede a stock cycle.  Industrial production shocked to the downside this morning (Dec 16) with a drop of 0.6%, the most in 3.5 years.  this should be a predictor of a coming substantial stock decline sometime in early 2016.

Prior Shemitah started in Sept 2007 ended in Sept 2008 just prior to the cascading down the fall and winter of 2008-2009.   I have seen that many expected a sell off during Shemitah, but the sell off follows the end of Shemitah.  We are now in the time line for a sell off (commonly referred to as the 7 year cycle).


Saturday, December 12, 2015

Dec 14, 2015 weekly outlook

Appears a short term bottom around Wednesday Dec 16.  This should align with FOMC interest rate decision.


GL traders

Over time cycles may vary in length...  The 10 week cycle may have morphed into a 7 week cycle over the past 2-3 months and 3x7 weeks changed the 20 week cycle into a 21 week cycle.  I expect at some point they will revert back to 20 and 10 week cycles.....

Sunday, December 6, 2015

Dec 7, 2015 weekly outlook

Pope Francis declares International year of Jubilee Dec 8, 2015:  odious debt to be forgiven!

There you go - all that odious debt GONE!!!!  Where did it go?  I guess the winners are those who took on debt that exceeded their ability to pay.

I have always found numerology in the Bible interesting.  It starts with 7 days...  There are lots of multiples of 7 (the 7th being a day of rest/worship).  There is 7x7 + 1 - Pentecost is 50 days after Easter.  Jubilee year happens ever 50 years....  Seven years is Shemitah (a stock cycle?).

So do cycles relate to biblical numerology?  Twenty weeks is 140 days (ten weeks is 70 days).  Subtract weekends and 20 weeks is 100 TDs (trading days) .Often we see 20 week cycles (or 10 week mid-cycles of 50 TDs).

I looked at Russell 2000 index to see if there was any weekly pattern (7 calendar days or 5 trading days).  Here is what I saw:

(30 min chart)


GL traders

Saturday, November 28, 2015

Weekly outlook Nov 30, 2015

Appears an inverted H&S pattern  almost ready to complete  (in a week or so).  With some short cycles still up (as well as the Wall cycle) I expect more sideways as the market attempts to make new highs.  Even though new highs are within range looks uncertain if there is enough upside force to achieve new highs.  Best guess is we continue sideways in a narrow range near term.

GL traders

Sunday, November 22, 2015

Sunday, November 15, 2015

Nov 16, 2015 weekly outlook

Seems the short cycles are being over run by the longer cycles.  We had a post in early November regarding these longer cycles (7 years - Jagular cycle, 3/12 years (40 + Months) - Kitchin cycle and the Wall cycle (20 weeks or 100 TDs 4 1/2 months).  There is also a 9 month cycle and 13 12 month and 18 month  cycle in the mix  derivatives of the Wall cycle.  Many of these cycles are set to bottom by around February as they move down together.

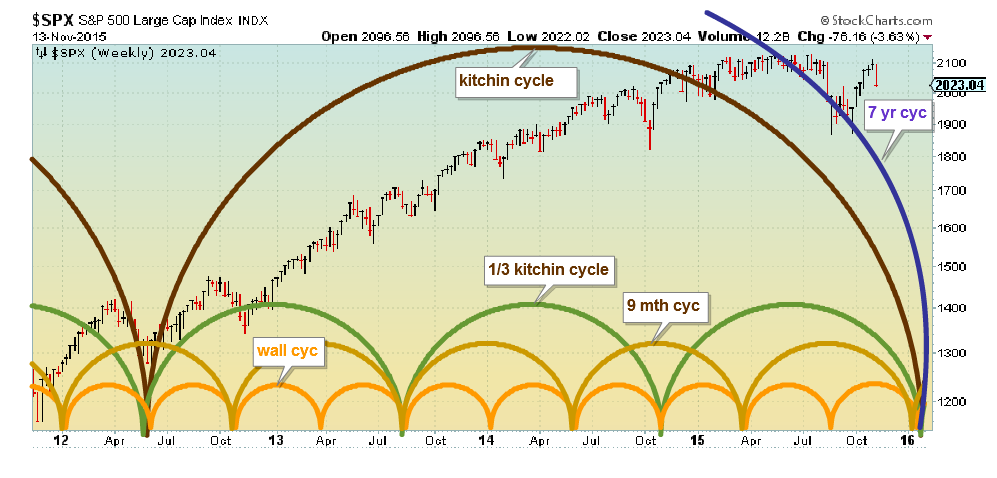
Following is a chart detailing the longest cycles which should bottom Feb/Mar time frame:

The 7 year cycle (Juglar cycle), the Kitchin cycle (40+ months - 3 1/2 years) and 1/3 Kitchin cycle (13 1/2 + months) are bottoming).

Next are shorter cycles like the 9 months and 4 1/2 months (Wall) cycles are bottoming.  NOTE: all cycles longer than the Wall cycle are multiples of the Wall cycle.  9 Month  - 2X Wall; 1/3 Kitchin - 3X Wall; Kitchin - 9X Wall; Juglar 18X Wall.... 

Finally there are the shorter cycles on which we normally focus.  In order to align  shorter cycles within longer cycles it was necessary to shift the shorter cycles (from time to time adjustments may be necessary to reflect the latest data).  Keep in mind this  is my opinion and should only be used as a single data point  of your analysis.  The short cycles should have bottomed by the end of the past week, then some upside (no market moves in a straight line) and then a thrust down as the longer cycles dominate into a bottom in Feb/Mar.  A low of around 1530  in the first quarter 2016 should not be a surprise.  Here is the short term:


GL traders


Saturday, November 7, 2015

Nov 9, 2015 weekly outlook

As expected the longer cycle is becoming right translated as it ended higher for the week as the half cycle was passed.  With shorter cycles still up the longer cycle will probably become even further right translated.  New index highs seem to be in the cards before we get shorter cycles turning down and with the longer cycle providing enough down side pressure to alter the direction of the market.


GL traders

Thursday, November 5, 2015

Nov 5, 2015 long term outlook

 
Kitchin cycle (42 months), 1/3 kitchin cycle (13 1/2 months), Wall cycle (4 1/2 months - 100 days)...
Long term overview (context for trading).  Hard down into 1st qtr 2016.

GL traders

Nov 5, 2015 gold bottom near?

Time to buy gold?  GL Traders.

Saturday, October 31, 2015

Nov 2, 2015 weekly outlook

Short cycles bottoming as 20 week cycle tops and turns down.  With 3 shorter cycles up starting early in the week I expect right translation in the 20 week cycle as it takes a week or so to gain down side momentum.  So the bias should be up for the week.


GL  TRADERS

Friday, October 23, 2015

Oct 26, 2015 weekly outlook

Past week not as expected.  Usually the last few days of October are bearish...  A few stocks like Amazon, Alphabet (formerly Google), MSFT today resulted in a huge jump in the NAZ.

When you look at the SP500 you see several stocks WMT, IBM, CMG cratering, but a few stocks like those above seem to offset (and then some) the losing stocks.  Not surprising though several stocks are beating as lots of stocks had estimates cut (some severely).  Earnings will be winding down soon.

Today also you had China making their sixth cut in interest an Draga (sp?) talking about more QE in Europe. So I guess the past couple of days are central banks inspired as well as earnings inspired.  We now have had about 3 flat to up weeks so time for a bit of pullback?


Been a couple of tough weeks to trade, around break even for the week.

GL Traders

Monday, October 19, 2015

Oct 19, 2015 - gold consolidating gains?

Gold broke its downward sloping trend line with a 12 week move up and is digesting those gains.  Expecting sideways to down move near term.


Watch closely for a good entry price.

GL traders

Friday, October 16, 2015

Oct 19, 2015 weekly outlook

With  10 and 5 week cycles down  there will be some downside pressure during the week.  With 2.5 week cycle up it will offset  some of the downside pressure and there should be additional pressure Monday as the 1.25 week cycle tops.

Expect some upside first of week and downside end of week.   Note the "W" formation on the chart, so be wary of possible upside breakout out.  But, an upside breakout failure seems more likely as most of these shorter cycles will have topped  out and headed down by the end of the week into the end of the month.


Also note CCI is ready to enter "over bought" area (up early week and then down?).  Finally the TSI may be rolling over and turning down (negative).


GL traders

Saturday, October 10, 2015

Oct 12, 2015 weekly outlook

Need to refocus on shorter swing trade cycles as market works sideways.  Last week was focusing too much on longer term outlook and missed the short term possibilities.  Volatility should continue as we have lots of issues (China, Syria/Mideast, no FED decision on interest rates, slow employment growth, etc).  So I have refocused on the shorter term possibilities.


Last week we had short cycles up.  This week short cycles mostly down, so expecting a negative bias.

GL traders

Saturday, October 3, 2015

Oct 5, 2015 weekly outlook

The past week showed a lot of volatility both up and down,  Friday for example opened down 200 or so points after the job reports numbers disappointed and spent most of the day recovering and ending with a gain (range for day on DOW about 400 points). If you bought an ETF like SPY at the open and sold near the close you made over 2%.  For the week most of the indexes were up,

The charts continue to look as if we should see some weakness during the week.  Probably enough volatility and with some accurate timing one should make 3% or more during the week.  Smallish positions best and use limit orders to limit risks....

Longer cycles are down.  the 10 week cycle (up) and 5 week cycle (down) offset.  The TSI zero line cross is bullish. So the weekly bias should be up early in the week but down for the week.

GL traders


Saturday, September 26, 2015

Week of Sep 28, 2015 and Oct outlooks

WEEK of Sept 28:

In the coming week all the long cycles are down (see second chart) as well as the 5 week cycle is down.  The longer cycles should be entering a HARD down time frame over the next several weeks, but should control the short term (next week) also.


Month of Oct:

As stated above the long cycles are down and should control the month of October and longer.  Expectations are that October could probably kick off a substantial move down 10-12% and give us an official "bear" market (pullback of 20% or more),


GL traders


Monday, September 21, 2015

Friday, September 18, 2015

Sept 21, 2015 weekly outlook

Longer cycles still down.  Also a couple of the shorter trading cycles are down. TSI expected to have a zero line cross from above (bearish).  CCI  continues to correct "over bought"  from this week just past.  This should result in a down week for the market:


GL traders


Saturday, September 12, 2015

Sept 14, 2015 weekly outlook

Expected the week just past to be negative biased, but it had a positive bias. Seems there are enough shorter cycles in an "up" phase to offset the longer cycles being down for the present.  Still a sideways movement expected as the market consolidates and resolves the next move up or down.  So a choppy market with 1-2% daily moves.  With the prior week up - will this week be down?

Some are looking at Tetrad (the fourth blood moon in a short period and Shemitah as indicators of a potential market crash in the coming couple of weeks (29 day of elul on the Jewish calendar).  A Black Monday?   Regardless we are over due a 20% market pull back over the remainder of 2015.


GL traders

Saturday, September 5, 2015

Sept 8, 2015 weekly outlook

When we look at the upcoming projected bottoms for longer cycles we see that bottom time is approaching. We see that these cycles are well into the second half of the cycle.  Normally the most down side within a longer cycle will occur in the last 1/8 to 1/4 of the cycle.  So far the market is flat in the first half of 2015 (topping process) and down in Aug/Sept.  So the bottom should occur by late 2015 or early 2016 as shown in this chart:

The 7 year, 3 1/2 year and 13 1/2 + month cycles are down.  This should provide a down side bias.

But if we focus on the shorter cycles  (20 week - 4.5 months, 10 week, 5 week, 2.5 week) we see they are all up at this time providing some off setting up side.  So do we go up or down?  A third possibility is sideways during the week. In my opinion we go sideways with a downside bias.  We may test the prior sub 16,000 DJIA level.

I expect around mid September we test that low and then in the last half of September we break below that level as some of the shorter cycles top and add to the downside pressure.  Here are the shorter cycles but it appears the longer cycles will cancel out the upside effect of these shorter cycles:

GL traders

Saturday, August 29, 2015

Aug 31, 2015 weekly outlook

Short term cycles (20 week or shorter) are up for the week.  The 2.5 week cycle should top by late week (Thur/Fri).  The longer cycles (Shemitah -7 years, Kitchin - 3 1/2 years, 1/3 Kitchin - 13 1/2+ months ) are down so this should limit the upside to 2040 or less. 


GL traders

Friday, August 28, 2015

Sept 2015 outlook

It appears we had a trend change of longer trends as the 3.5 year (Kitchin) cycle turns down along with some shorter but intermediate length cycles turn down.  Expect the averages to stair step down over the next 5 months (or longer) as these cycles play out to the downside.  Of course this will take time as after each move down the market pauses and goes sideways as it digests each down move of size (say 5-10% or so).  Expect the SP500 to trade in the 1860-2000 range the first half of September and then move down the second half of September.


GL traders

Saturday, August 22, 2015

Aug 24, 2015 weekly outlook

Traveling and will furnish updated charts when I have the time and better internet access.  Interesting week just past.  Mid year I posted a longer term outlook.  I posted longer cycles (Kitchin cycle 3 1/2  years) and 1/3 Kitchin cycle (13+ months). .  Also noted that a down turn in these longer cycles would accelerate in the last 15-20% of the cycle and these cycles should dominate during that time frame).  Projected bottom on  these longer cycles is around year end.

We may have now entered that down draft from the longer cycles as the up turn in shorter cycles seems to be totaled dominated.  I told you the first couple of weeks after the nested bottoms would tell us if we were entering a longer term trend change....  I suspect we have and will take a closer review of this past week's action.  . 


Appears longer cycles have taken over to the down side and should control for most or all of  2015.  Since down moves tend to be shorter and cover a lot of amplitude in a short time expect moves to be volatile and violent.

If we get a "bear" market then expect at least a 20% (400 points)  pull back in SP500.  Remember 20% down wipes out 40% up move,,,,

GL traders

Friday, August 14, 2015

Aug 17, 2015 weekly outlook

Appears we got a nested bottom by mid week (2-3 days later than I had projected).  By Friday indexes were up for the week as I indicated I believed would be the case as all the intermediate to short cycles I display in my charts turned up from the nested bottom.

In the coming week all these cycles will be up and the week of Aug 17 offers the best chance for new highs(SP500)  near term.  Expect volatility to continue with problems in China.  Russian economy is in a mess.  So is Brazil's economy.  Of the BRICs only India seems to be in relative decent shape.  The BRIC is turning into sand???  So longer term (Sep-Oct) markets look less positive.


Russell 2000 ETF:

update  8/18 after close:


GL traders

Friday, August 7, 2015

Aug 10, 2015 weekly outlook

We may have seen nested bottoms Friday mid day, but may see a slightly lower low on Monday.


CCI near over sold so a slight down move Monday would result in an over sold signal.  All the cycles shown above should be turning up so expect the week to be up.  The strength of the move should let us know if we should expect new highs over the next few weeks.  For the year SP500 is flat...

GL traders

08/12 update --- today's bottom and bounce back has the feel of a bottom.  I updated charts to reflect this:


Saturday, August 1, 2015

Aug 03 2015 weekly outlook

Nested bottom seems likely during the week, expect bottom of 2060 or less:


Good luck traders

Tuesday, July 28, 2015

August 2015 outlook and beyond

The first week of August should see the nested bottom of the Wall (20 weeks, 4.5 months) cycle, 10 week, 5 week, and 2.5 week cycles.  The next 20 week cycle bottom of nested bottoms will be late December.  But unlike the bottom forming now this next bottom will have 2 longer cycles also bottoming (Kitchin cycle - 3.5 years and 1/3 Kitchin cycle - 13.5 months) and expect a more substantial move down.

It is likely this will limit the upside of the 4 cycles (Wall, 10 week. 5 week. 2.5 week ) we look at for swing trading will have less upside effect than one normally sees.


The amplitude of up moves should give a hint as to how much downside we see by year end.

Good luck

Saturday, July 25, 2015

July 27, 2015 weekly outlook

The fourth cycle (2.5 week) tops and turns down.  By the final day of July all the cycles I am plotting will be down.    By the first week of August we should see a nested bottom of these 4 cycles. Here is a visual:

GL traders

Monday, July 20, 2015

Jul 20, $gold outlook

Aroon cross suggests a buy within 2 days....  Also several cycles forming a bottom nest.


GL gold buyers

Friday, July 17, 2015

July 20, 2015 weekly outlook

Market showed unexpected strength for the week just ended!!!  The upcoming week should show some weakness as the 3 longer cycles are down and the 2.5 week cycle is up
 so the bias should be down into the first week of August.

Another way to look at short trades entry/exit:


Good luck traders

Friday, July 10, 2015

July 13, 2015 weekly outlook

With all the news out of Greece, China, NYSE down 4 hours, etc. you would have expected a down week yet the market was almost unchanged.  As I pointed out last week the 2 shorter cycles were up and had a quicker cycle move over a short time offsetting the larger amplitude of the longer cycles over a longer period.


Cycle alignment (wall and 10 week down, 2.5 week top and down) suggests a down week for the week of July 13.

GL traders

Thursday, July 2, 2015

July 6, 2015 weekly outlook

With the Wall cycle and 10 week cycle down the week has some downside pressure.   Even though longer cycles have larger amplitudes it is spread over longer time frames so the per day amplitude is usually less (especially in the first half of the down leg). So with the 5  week cycle and 2.5 week cycles up probably will see some upside bias for the week, but limited move up due to down side pressure of the longer cycles.


GL traders

Saturday, June 27, 2015

June 29, 2015 weekly outlook

Should see weakness first 2 days of the week with a reversal up the last 2 days of the week based on cycle alignment of 3 cycles down and 2 bottoming by end of day Tuesday and turning up as 10 week cycle tops to turn down.


GL traders, have a good holiday...