The Kitchin cycle at 42 months is approximately 1/3 of a 10 year cycle (3 x 42 = 126 months or 10.5 years). If we use the Dewey cycle length instead (40.68 months) it is even closer (3 x 40.68 = 122.04 months). So maybe the 10 year cycle is really 10.17 years? Lets look at this graphically:
Now this is interesting. A Kitchin cycle starts about the same point as the 10 year cycle does in 2002 and ends about the same point as the 10 year cycle does in 2012. So it appears the Kitchin cycle is 1/3 of a 10 year cycle? Drilling down the a Kitchin third is 1/3 of a Kitchin cycle:
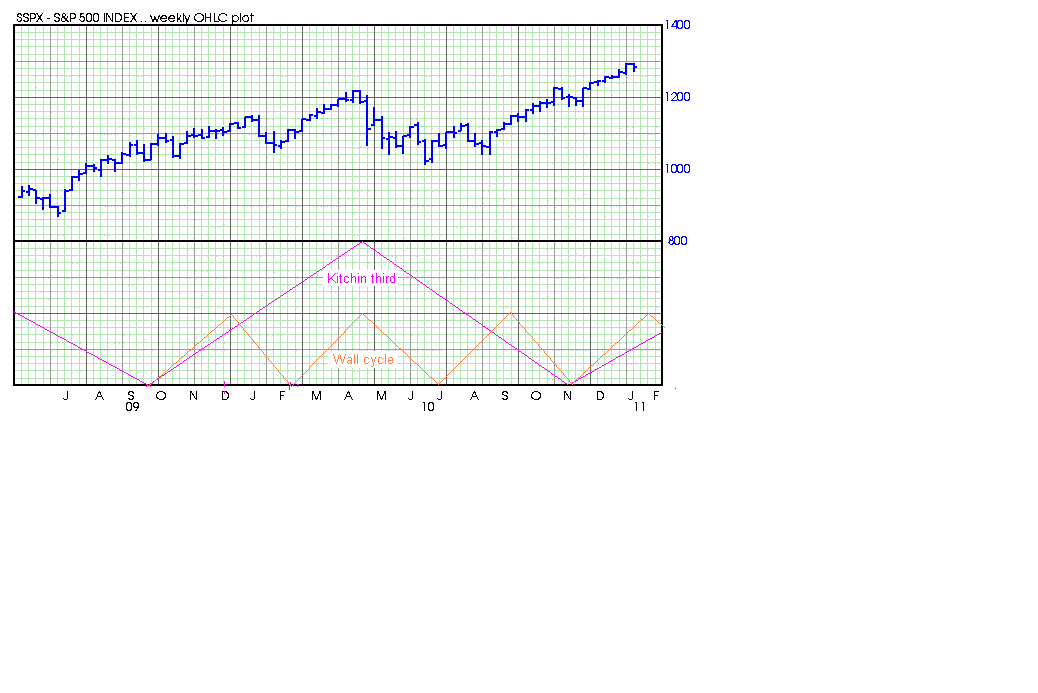
Drilling down further the Wall cycle (20 weeks) is 1/3 of a Kitchin Third (or 1/9 a Kitchin cycle). See for yourself:
As a result you have the 10 year, the Kitchin, the Kitchin Third, and The Wall cycle bottoming together in 2012 (just as they did in 2002). And this my friends does not look good for the year 2012.
Continuing this - what is 1/3 of 20 weeks. 20 weeks is 100 trading days so 1/3 is 33.33 days or what I commonly call the 33-34TD cycle. Here is how it looks graphically:
Now 1/3 of 33 is 11. So is there an 11TD cycle? Lots look at a chart:
Cliff Drokes (cycle authority) claims the 30 year cycle is one of the more important cycles (3 x 10 year). So lets summarize what we have learned. From the Kitchin cycle using multiples of 3 or factors of 3 we have the 30 year cycle, the 10 year cycle, the 3.33 year cycle (approximately), the 14 month cycle, the 20 week cycle, the 34Td cycle and finally the 11TD cycle. In all my reading of cycles
I have never seen all these different cycles related to the Kitchin cycle this way.
Gl traders. Your thoughts appreciated (pro and con).


Inlet, Thanks for putting it in graphic form with charts. Very interesting. Makes it easier for me to understand it. Definitely see the impact of the cycles. I know you say they are road maps and not GPS, but I have a question on the topping of the 20 week cycle. In the chart showing the 20 week as a third of a kitchin third, it looks to be at the top around Jan 21. In the next chart where you are breaking it into the 34TD cycle, it looks like it will not top until the very end of the month...Jan 31. Can you clarify? Thanks again, Best
ReplyDeleteBest, I expect the 20 week cycle to top by the end of the month. As you so astutely pointed out it depends on exactly how you position the pivot points of the cycle.
ReplyDeleteIt could be this week, so the best answer I can offer is you watch the market for clues it has turned. If we have a hard down by the end of the week we can probably assume the earlier point is turning point. Determining this is a matter of judgment - no guarantees.