The 10 year cycle bottomed in 2002 and should do the same in 2012. Same relative position as in 2001 - check. The 24 month (2 year cycle) is a factor of 10 (10/5 = 2) so it should have the same relative positioning in relationship to the 10 year cycle - check. The 3.39 year cycle is about 1/3 of the 10 year cycle (3.33 years would be 1/3) so its alignment should be shifted .18 of a year ( 2.16 months or 64 days) forward from its bottoming relative to the 10 year cycle in 2002. From a purely rational view 2001 should be the best pattern match (with the noted exceptions) for 2011.
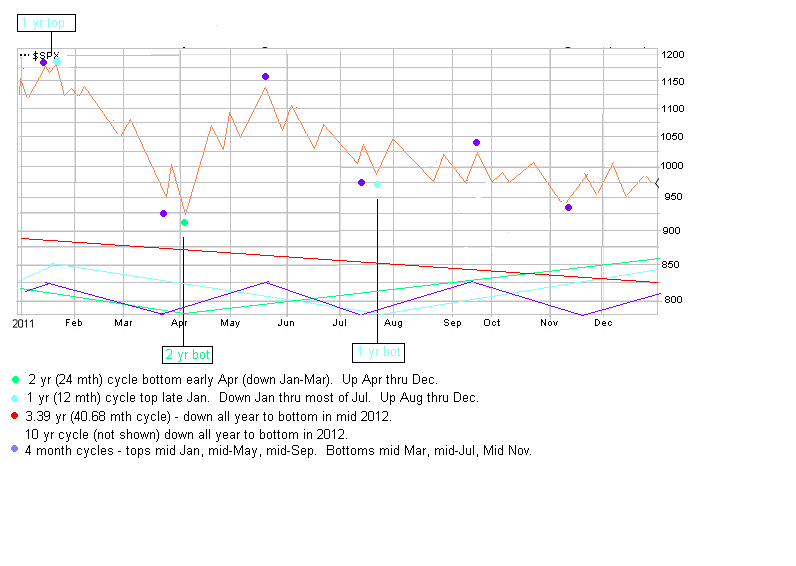
With this in mind I have done a crude projection for 2011. From late Jan to mid Mar the 10 year, 3.39 year, 2 year, 1 year and 4 month cycles should all align down. So the low for the year could be around the end of the third week of Mar (estimate 925 - may be too high). The high for the year could be 3rd-4th week of Jan or mid May (estimate avg 1150). The latter part of the year you have the 1 and 2 year cycles up. This will offset (at least in part) the downside of the 10 year and 3.39 year cycles. So I would expect the 4 month cycle to be relevant from Aug-Dec.
Warning: The following depiction is for visual representation of the above discussion only and should not be relied upon for trading.
No comments:
Post a Comment