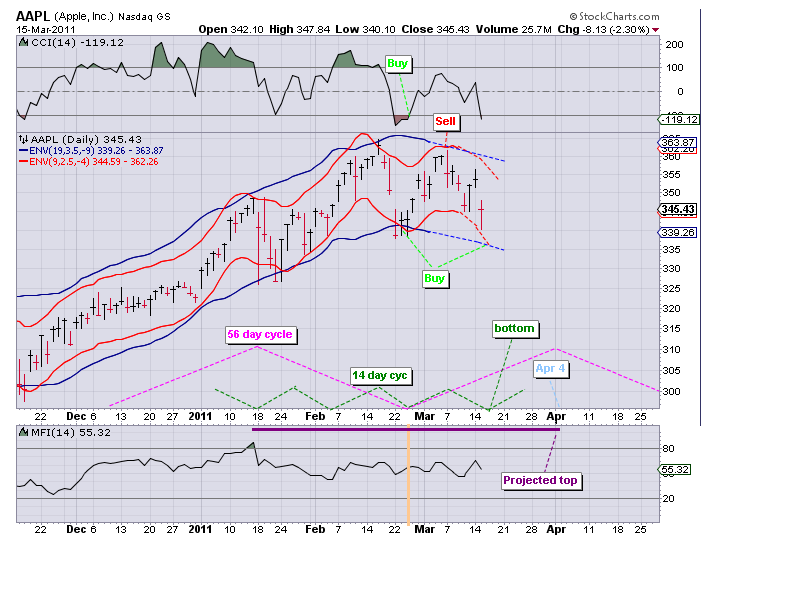
Appears APPL may have made a double top (forming an "M" pattern?). Looking at two shorter cycles a 14 day cycle should be bottoming and turn up for 7 trading days. A 56 day cycle should top around Apr 4. I would not be surprised if APPL makes a lower high Apr 4 (following the :M" pattern) as it appears an even longer cycle may have turned down.
Here is a picture:
GL traders, do your own analysis.
03-16 long term charts
Looking at the longer term it appears that the best case scenario is a range from $300-360. Not sure though it can maintain that range to the downside.
Here is the chart:
GL traders

i hope you shorted some 3/15, nice.
ReplyDeleteS
btw, time to put nat gas stocks up on the block. they are busting loose while market tanking.
ReplyDeleteECA, SWN, HK
gotcha.
Sue
ReplyDeleteDang analyst stole my research and did a downgrade this morning (I wish). No positions - was strictly a reader service post. Hope you are making big $s.
Did a post featuring SWN for natural gas.
Don't be a stranger.
Inlet