Sunday, December 28, 2014

weekly outlook Dec 29, 2014

Watching for sell zone and by around Jan 2 (5 Trading Days) should be near short cycle (around 13 TDs) bottom....

GL Traders

Update Dec 31 close update:  looks like Jan 2 should bring us a short term bottom (12-13 TDs)

Jan 2 after close:  Looks like mid day may nave been short cycle low


Thursday, December 25, 2014

The year ahead - 2015

how the cycles play out for 2015:

A low first week of April and  first week of October.  Lesser lows first week of January, first week of July and end of year...     Longer term cycles indicate a bearish year with a major low early 2016.

Bradley Siderograph 2015

Outlook for 2015:


Saturday, December 20, 2014

Weekly outlook for dec 22, 2014

The bounce definitely had more vigor than I expected, but I would guess I was not alone.  This short cycle is topping (may have topped) in  the very near future.  SPX could set an intra-day high early in the week.  Given it is a 4 day week the week could close up for the week, but I expect it to show downside tendencies by the end of the week.  Given recent volatility any move could be significant.

Here is a visual:


For swing trading we generally look at shorter cycles like the 13-17  TD cycle and get too fancy with our charts and analysis.  Maybe we should KISS (Keep It Simple Stupid) like this:


GL traders

update 12/23 - As suggested the averages set new highs here in the first part of the week.  May have some upside left before Christmas??

update 12/24 - today the DJIA was up most of the session, but closed only slightly higher and SPX was slightly negative.  What one would expect if a short term top was being made....

Sunday, December 14, 2014

weekly outlook dec 15, 2014

Expecting a bit of a move up during the week as shorter cycle bottomed and turns up.  See for yourself:


update 12/17 - got the expected bounce....

update 12/18 - more energy behind bounce than expected .....

GL traders

Sunday, November 30, 2014

Weekly outlook Dec 1, 2014

I suspect we may have been seen (right translated?) a top.  MFI is diverging and headed down while market was topping (going up) past 2 weeks.  Also, TSI experienced a bearish crossover.  Finally crossover of envelop upper lines (11 days and 23 days) are giving a sell signal.  With multiple indicators giving bearish/sell signals the  coming week may be the first down week in a while.    Finally the Russell 2000 is about where it was when I bought RWM 3 weeks  ago.

Here is a visual:


Good luck traders

Saturday, November 8, 2014

Nov 10, 2014 weekly outlook (Updated Nov 12)

Less downside pressure than expected as market continued to push ever so slowly higher.  Still it looks like a top formed.  We should see a mid cycle  (40+ TDs cycle) by Nov 17 after a right translated top this past week.  I do not expect a large pull back as this is a mid cycle pull back.  See prior mid cycles for an idea of the extent of mid cycle corrections (usually 2% or so).

Here is a visual:


GL traders

Tuesday, November 4, 2014

Nov 3, 2014 weekly outlook (Updated)

The current week should have seen the topping of the 20+ TDs cycle.  If we get a right translated top (past cycle midpoint) we could see slightly higher highs on S&P early in the week. but expect a top no later than Tuesday  even in that case.


GL traders

Bought some RWM on Friday, 2 cent per share loss at close.

11/4 update at the close:  So far volatility less than expected,  but appears top forming.

Saturday, November 1, 2014

Nov 2014 monthly outlook

Given recent volatility moves in November may be substantial on a daily basis.  Over longer periods expect ups an downs to largely cancel over the month of November.  I expect November to be good for traders, not so good for investors.

We should be at/near a top to start November.  By mid-November the shorter (20+ TDs) cycle should bottom (Nov 17 +/- 1 day).  At that point the shorter cycle (20+ TDs) turns up and the longer (40+ TDs) turns down.  So  they offset to a large degree thru the end of the month and into early December.

I expect we could see around 2% pullback in the month.


GL traders

Sunday, October 26, 2014

Oct 27, 2014 weekly outlook

Last week I said to expect some upside from the shorter cycles.  Was stronger to the upside than I expected.... 

This week less upside potential as shorter cycle tops and turns down.


GL traders

Sunday, October 12, 2014

Oct 13, 2014 weekly outlook

I have shown you longer term cycles that indicated we should see market weakness and pullbacks in  the Aug-Oct 2014 time frame.  Even longer cycles may bottom in 2015-2016.  I am beginning to believe the market is now under the influence of these longer cycles (3.5 year Kitchin cycle, 13 1/2-15 month 1/3 Kitchin cycle, 20 week Wall cycle).  I  have also recently shown you the 7 year Juglar cycle....

We may get an attempt to rally this week as the large banks report, but any rally will be short lived.  Here is the outlook (Longer cycles now synched down):


GL traders

10/14/2014 update

An advancing market displays the characteristic of right translated cycles (longer periods advancing than falling).  I have mentioned this several times over the past 4-5 years.  A declining market is characterized by left translated cycles (down legs are longer in time and decline more than they advance).  Usually the declines are more pronounced in a major decline than  the advances were in the same amount of time.  I showed you a chart recently showing major cycles advancing about 5.5 years to lose those advances to a large extent in 1.5 to 2 years.  Here is the recent market  - note the left translated cycles (peaks left of the center line of the cycle):


Left translation continues?


Saturday, October 4, 2014

Oct 6, 2014 weekly outlook

Last week said a short term bottom was expected.  Bottom was 1 day later than expected. Recovered a substantial part of the loss from earlier in the week by Friday.  Short term it appears we should see some gain first part of this week. Expect a top by Friday unless the unexpected happens in Europe, mid East or China.  We could also see multiple cases of Ebola in Dallas (fear is not good for the market).

But based on short cycles expect continued volatility with market highs in latter part of week or fist of following week...

Here is a short term chart outlook:


GL traders.  I expect to replenish my RWM positions by end of week...

update after close 10/07/2014

Weakness continued and buy signals failed to materialize...

Longer term charts showing weak Oct seem to be in effect.

Sunday, September 28, 2014

sep 29, 2014 weekly outlook

This past week all the major indexes finished down.  A lot of volatility.  Same type of activity last time a QE was set to expire as is about to happen in October.  Is this the cause of weakness and volatility?  Unsure, but it does raise the question....

Looks like we should see a short term bottom by Sept 30 (+/- 1 day).  Medium term look for more volatility and some weakness.  Maybe we finally get a correction (-10% or more), if the FED quits flooding the economy with newly printed currency.

Here is a short term outlook:

GL

Saturday, September 20, 2014

sept 22, 2014 - Is it time?

take  a look:


Have we topped?  I have a full position RWM.

We may see a try at higher highs by mid week, but I suspect we are at/near a high:


GL

Update:  9/22 sold a tranche of RWM; hope to buy it back if R2K pops a bit.:

update sep 23


Sunday, September 14, 2014

Sept 13 weekly outlook and more

 
More of a downside move than anticipated, but it is what it is.  I continue to hold  RWM shares (R2K inverse) and have about a 1% gain at the close Friday. Because it seemed I had gotten out of sync with the market I have attempted to fix that.  I hope I have.  Here is that attempt:


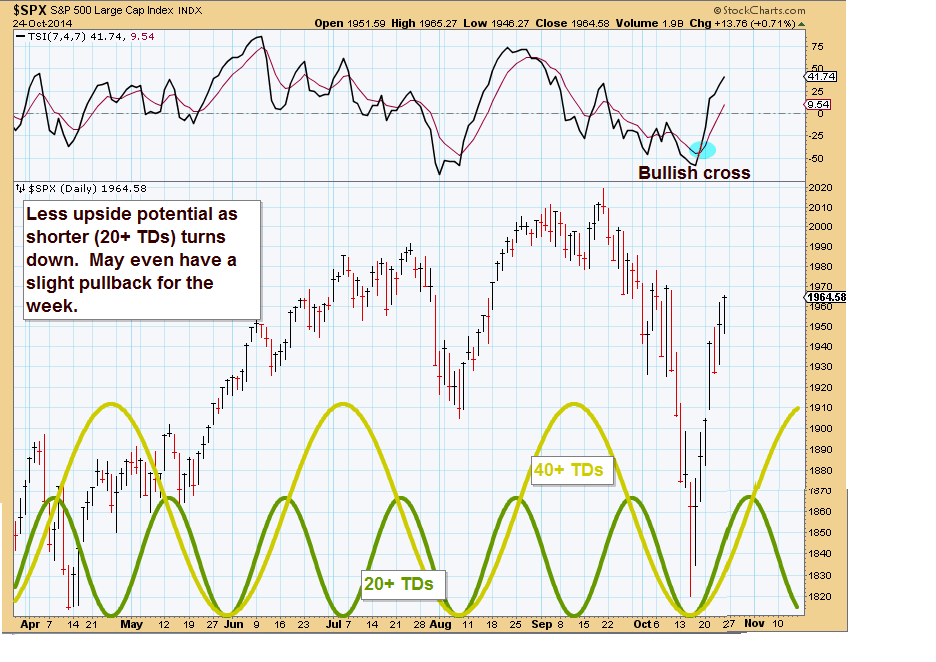
Longer term the group of longer term cycles I have referenced in the past (Kitchin, 1/3 Kitchin and Wall cycles) seem to be coming together to provide a more protracted downturn.  The Wall cycle (20 weeks, 4.5 weeks) should be at a top, the 1/3 Kitchin 13,5 months is over 6 months up from its last bottom and topping.  The Kitchin cycle is well past its top and should be in the area where it goes hard down soon.

See for yourself:


How much of a pullback could we expect?   I looked at the nesting of cycles longer than the Kitchin  some time ago.   Two Kitchin cycles make up what is called the Juglar cycle (7+ years).  This cycle usually right translates and goes up 5-5 1/2 years and down 1 1/2-2 years.  Last bottom was likely early 2009 (up 5+ years 2002-2007) and down late 2007 into Mar 2009).  Here is an update of a chart I maintain showing the current iteration of this cycle:

If I have the timeframes correct then the Juglar Cycle should start its pullback soon and it could get nasty,

So this covers the long cycles?  Hardly!!! Here are longer cycles (that I posted quite a while [2-3 years] ago and their likely placement in time (2 Juglar cycles in a Kuznet cycle):


We are overdue for a downturn (some claim FED policy has elongated some of these longer cycles by 1-2 years and if that is the case any downturn could be very fast and powerful).
GL traders

Sunday, September 7, 2014

Sept 8, 2014 weekly outlook

The prior week traded in a very narrow range over the 4 trading days.  It was down going in to Friday and turned positive for the week on very poor employment news. The theory seems to be slack employment will restrain the FED when it comes to raising interest rates.  Still QE3 is set to wind down by  October.  Going to be interesting to see if the market actually reacts to this slow down in printing dollars.  If so we should see reaction starting soon.  Russell 2000 was little changed.

Appears market will continue sideways with a spike up during the week of 10-15 SPX points to set a top around 2020.  By the end of the week probably not  much change.

Here is a visual:


GL traders

Update Sep 9:
Looks like RWM forming inverted H&S pattern:


VTL (Valid Trend lines) http://sentienttrader.com/hurst-trading-room/blog/peak/
GL

Monday, September 1, 2014

sept outlook - Hurst chart

Currently looks like down into third week and some recovery toward end of month.
http://sentienttrader.com/hurst-trading-room/blog/

GL traders

Sep 2, 2014 weekly outlook

Should top (or has topped?) and begin  down for next 8-9 TDs (trading days).  After that maybe one more high.  Taking more time than expected to top and give us a respectable pullback.


Picked up small amount of RWM (R2k Inverse) - 200 shares - last week.  Will add if expected pullback starts.  Currently around break even.

Sunday, August 24, 2014

outlook for week of Aug 24, 2014

I was too cautious in my outlook as the SPX was up about twice my target.  Thought it might over shoot my target and mentioned if we set new highs to consider a position in RWM. Well ^Rut still lagging to upside and no new high (ditto for the DOW).

Looks like we may have reached a short term swing high verified by Friday's failure to close higher than Thursday  See the chart:

May be time to short the market (RWM)  GL traders.

Sunday, August 17, 2014

Weekly outlook for Aug 18, 2014

Hard to figure - was the market up/down/sideways last week.  The SPX500 was up about 1%, the Dow just over 1/2% up and R2k was down. As you probably know if you have followed my blog for a while I trade RWM (inverse R2K, R2K down then RWM up).  I guess I can claim to be right by picking one Index, but I generally chart SPX so we were sideways almost (right on no big move) and was looking good mid week, but not so good by week end.  Not exactly as I called it, but close.

This next week we have 3 shorter cycles (1 month, 2 month, 4 month) up with some longer cycles down.  So moving up will encounter some headwinds (longer cycles down and who knows about Ukraine, Iraq, Syria, Hamas, etc.).  From a cycle perspective it looks like mixed during the week as the Market struggles upwards (my guess would be around +20 pts. on SPX500).

Here is a visual:


If we test/exceed old highs might want to trade some RWM?

GL traders.

Sunday, August 10, 2014

Outlook for the week of Aug 11, 2014

I felt  the prior week would be mostly flat for the week with possibly a small drop.  It was flat with a small increase. Close, but not a bull's eye hit.  Looking at a short term chart it looks like monthly (lunar -28/29 calendar days) should bottom by Tues 8/11 (+/- 1 day) along with the half cycle (10-11 TDs).  So I see some potential downside in the early week.  By the end of the week the shorter cycles will partially offset the downside pressure of the longer cycles.  So it looks like a flat to down week.

Here is a visual:


 GL traders

Sunday, August 3, 2014

Aug monthly and Aug 3, 2014 weekly outlook

I noted in my post (start of 2nd half) the outlook for the remainder of the year.  Expectations were for a pullback into late September.  Too early to say for sure, but the outlook has gotten more negative this past week.  Here is the updated chart for the next few months:


This next week the  2 month cycle should top and turn down resulting in 4 medium length cycles down....  This should more than offset the impact of shorter cycles such as the monthly cycle which is up.  There may be an attempt to rally but any upside should be limited over the next week and shortly after that the monthly cycle will also turn down leading to a negative outlook for August.  In summary - sideways to down this week and then down.  Here is a visual (short term):


FIB target 1 1898...


GL traders

Saturday, August 2, 2014

Cycle lengths

I have noted some interest in cycle lengths.  Here is a summary (other sources may list other cycles):


Cycles according to WD Gann:

Thus the 30 year time cycle will be divided into important probable turning points as follows:

1/8 - 3.75 years
1/4 - 7.5 years
1/3 - 10 years and (3/8, 1/2....) so on .

The further divisions of time and price are derived from this master chart as follows:
144*144 = 20,736.

The important divisions are:
Div. Days   Weeks  Months Years
1   20,736  2,962   682    56.8
1/2 10,368  1,481   341    28.4
1/4  5,184    740   170    14.2
1/8  2,592    370    85     7.1
1/16 1,296    185    43     3.55
1/32   648     93    21     1.77
1/64   324     46    11      .89
 

GL traders

Sunday, July 27, 2014

July 28, 2014 weekly outlook

Overall earnings have looked good, revenues less good...  So far, the market has not responded much to these earnings.  Yes, SPX has set (barely) new highs.  But, the "M" pattern did not develop this past week, but the right leg may still develop over the next couple of days.  See for yourself:


Update 7/30 - With today's GDP report we have had considerable inventory build over the past 3 qtrs (around $200B).   The Kitchin cycle (a longer cycle of around 3.5 years) is sometimes referred to as the inventory cycle.  Once companies get too much inventory they slow down purchases because carrying inventory too long is expensive...  This pullback can lead to a stock market correction.  Here is a visual presentation:


GL traders


Saturday, July 19, 2014

July 21, 2014 weekly outlook

Sometimes it helps to look at recent past activity to get an idea of what is happening and the likely future  market.  Here goes:


A double top forming an "M" is a fairly common pattern and is formed as shown above.  All inputs considered if the "M" is well formed (not slanted) with even tops and legs what can we conclude?

In the above chart we see the 10 TD cycle contributing most to the pattern. We can conclude that all cycles longer than the 10TD and 20 TD are cancelling each other out.  This cancelling effect generally happens when a trend reversal is in the process of setting up.  So if the pattern completes (right leg down next week) we are looking at an intermediate length trend reversal (possibly)????

Friday, July 11, 2014

July 14, 2014 weekly outlook

The week ahead:


- short term 10TD cycle should bottom  along with 20TD cycle mid week (WED +/- 1 day.  Probably no more than 1% downside over next 2-3 days.

Warren Buffett's favorite measure of over valuation is when the value of the total market index exceeds the GDP.  We have reached that level, so maybe just a matter of  when the market corrects?


GL traders

Update 07/16:

Update 7/17:

July 20 is this Sunday which means if the 2009 bull market top wasn't already seen on 7/3/14 then it should be expected this week.

http://www.safehaven.com/article/34527/lindsay-the-2011-basic-advance

Sunday, July 6, 2014

July 7, 2014 weekly outlook

 For the week:

 
Appears 20 TD (1 month cycle) down, and 10 TD (2 week cycle) down...  Longer cycles (15 month, 7.5 month, 3.875 month) cycles down.  The 40 TD (2 month) cycle is up.  Should give us up to 2 weeks down (3%?).