Last week's outlook was not all that great. Yeah, looks like we bottomed as expected (but 1 day earlier than actually expected). And we had some upside by the end of the week (but fell Friday).
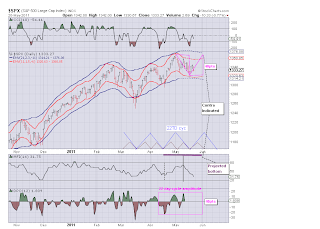
Looks like things are getting funky. I do a projection using MFI and looks like it is projecting a bottom the first 2-3 days of June, yet that should be the top for the 22 day cycle.... As I have mentioned for the past couple of weeks there is a 1 year cycle that is getting into the time frame on the down leg where it may dominate. This may explain the contradictory indications. One theory is the most of the downside of a longer cycles happens in about the last 15% of the down leg. For the 1 year cycle that would be 26 weeks for the down leg and 15% of that is 4-5 weeks (more or less).
So the situation next week is we have the 22TD day cycle pushing up, but may have the 1 year cycle beginning to push down hard. Also the 20 week Wall cycle should be topping. My guess is we may get some upside earlier in the week and run out upside momentum by mid week as the Wall cycle tops. We need to watch closely - because if this is the case we need to get out of the way of a probable pullback that could last into July (maybe early August). Based on the 22 day DPO it appears that the last top may not be reached.
Here is the SPX shorter term chart:
I took a look at some FIBS. Thursday was just above the FIB of 1341.67. Friday did not hold above that level. This level has to be exceeded and held if we expect a run at the 1361.06 FIB. Last top exceeded, but could not hold above this level. If we can get above 1361.06 and hold say for 3 days we can make a run at 1392.43 or 1402.02. On the downside the FIBs to watch are 1329.69. If we can break below that and hold below it for 3 or so days we will probably fill the gap and go to 1310.30. If we can break below 1310.30 then watch out below?
Here is a chart of the FIBS based on the 1982 low and 2007 high:
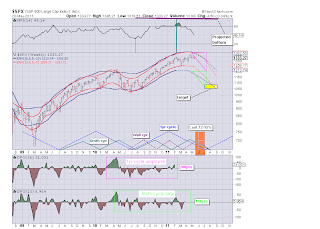
I expect by the end of May we will have a good idea of how the market is going to respond by watching these FIBs. I also looked at a weekly chart of the SPX. It is my belief that the 1 year cycle down leg will show up with strength possibly within the next week. If that happens we should see a convincing break of the 1329 FIB level.
Overall I believe we could see some (not a lot) of upside early in the week and get a reversal before the end of the week. Here is the weekly SPX chart:
Gl traders. Do your own analysis.
Update: http://www.safehaven.com/article/21062/sp500-cycle-update


No comments:
Post a Comment