Showing posts with label Wall. Show all posts

Wednesday, March 30, 2011

What the cycle analysts are saying - part 3

Tonight we look at cycle analyst David Knox Barker.
 
http://www.safehaven.com/article/19583/global-stock-market-cycle-forecast-2011

Mr. Barker probably goes in to more detail about his analysis that the other analysts I have covered. He claims cycles can vary based on certain Fibonacci ratios (an illustrates this in his writings). One of the more interesting analysts I think. He also claims that government intervention extended the long wave (K-wave) cycle into 2012 - and it should have actually bottomed in 2009. He believes the current K-wave started in 1949 (or early 1950) and would have ended in 2009 or early 2010 (60 years) except for government intervention. A K-Wave is and made up of 2 Super cycles (same as Drokes).

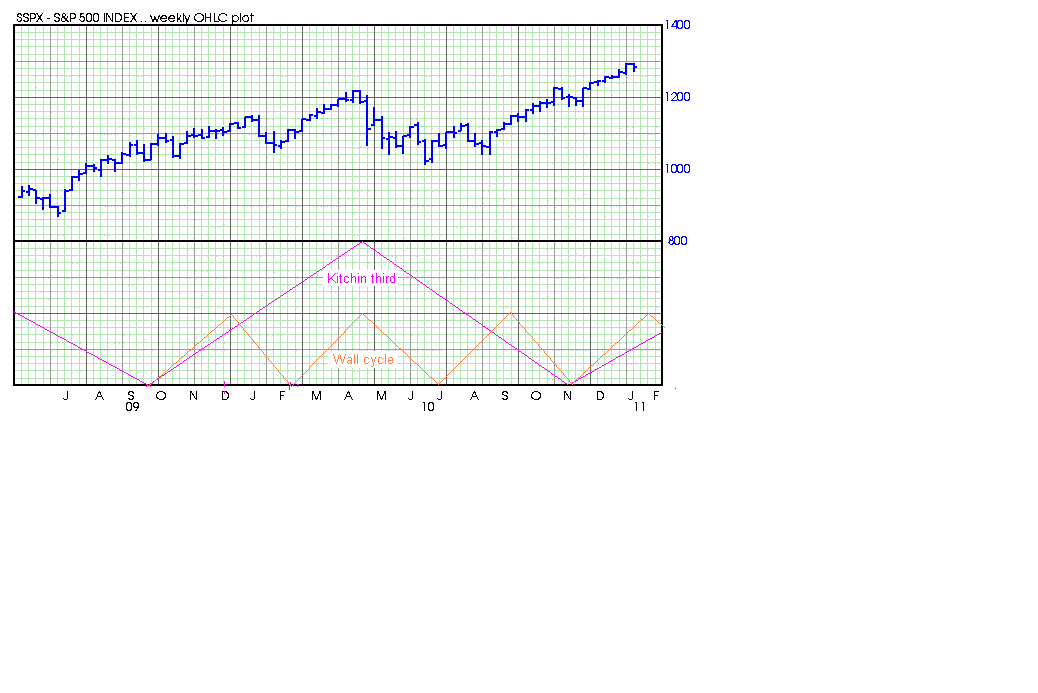
He focuses on the Kitchin Cycle (he set it at 42 months - others use 41 months and 40.68 months (3.39 years) and some call it the Dewey cycle. He says there are 16 Kitchin cycles within a K-wave (8 within a Super cycle). The other cycle he focuses on is the 20 week cycle which he calls the Wall cycle (after PQ Wall explained the relationship between the 20 week cycle and the Kitchin cycle). There is 3 sets of 3 Wall cycles within each Kitchin Cycle. The rule of third last and weakest makes the third Wall cycle decline harder than the other two in the three sets and tends to show up clearly on a chart, which was what occurred on July 1, 2010

Let' summarize:

  • K-Wave (1949-2012)
  • Super cycle (1949-1981, 1981-2012 avg 31.5 years)
  • Kitchin cycle 42 Months (Mar 09 - Sep 12)
  • Wall cycle 20 weeks (pivot date July 1, 2010)
Here are the longer cycles:


And the Kitchin and wall cycles:

GL traders.  I hope you appreciate the similarities and differences of the analysts.  Next you will see how one analyst believes there are 3 Kitchin cycles in a 10 year cycle...    So be sure to read about the next analyst.

Sunday, February 27, 2011

The long cycles

I mentioned the Juglar cycle in my last post.  It is supposedly 7-11 years.  I find that much variance to be too large to be helpful, so I am not including it.  As an economic cycle I will (for the time being) assume the 10 year cycle is the resulting cycle in the stock market.

The 10 year cycle may actually be 10-10.5 years (120-126 months).  My reasoning is that it is 3 Kitchin cycles in length.   Most people refer to the Kitchin Cycle as 41 or 42 months.  One authority claims it is 40.68 months. that is about  122 months or 10 years and 2 months. If the Kitchin cycle  is 42 months then 3 cycles is 10 years 6 months (126 months or 10.5 years).

Each Kitchin cycle is composed of 9 Wall cycles of 20 weeks.  An average month is 30.42 days (365 / 12).  So a Kitchin cycle is  1237. 5 days (40.68 X 30.42) to  1277.6 days (42 X  30.42).  A Wall cycle is 140 days (20 X 7). That means 9 wall cycles is  1260 days.  We have 1237.5 days (Kitchin cycle of 40.68 months), 1260 days (9 Wall cycles), 1277.6 days (Kitchin cycle of 42 months). 

So lets go with 41 months for the length of a Kitchin cycle (1247 days).  If there is 3 Kitchin cycles in our 10+ year cycle that is 3744 days (3 X 1247 + 2 leap days).  Since 10 years is 120 months which is   3652.4 days (120 x 30.42 + 2 leap days).  That  is 92 days (3 months) less than 3744 days.  So that makes the 10+ year cycle 10 years and 3 months long. 

Let's review: 
  • The Wall cycle is 20 weeks. There are 9 Wall cycles in Kitchin cycle.
  • The Kitchin cycle is 41 months long.  There are 3 Kitchin cycles in the 10+ year cycle.  This 10+ year cycle may be the Juglar cycle?
  • The 10+ year cycle is 10 years and 3 months long.
  • Three 10+ year cycles  30.75 years or equal a Supercycle.
  • Six 10+ year cycles is 61.5 years or a KWave
Note:  A Supercycle is 2 Kuznets cycles  in length - so a Kuznets cycle is about 15.37 years (or 1.5 time the 10+ year cycle.)

We see from this each cycle is a multiple of a shorter cycle.  With this in mind  I redid the chart for the very long cycles and updated my prior post.   Here is my latest attempt to chart the 10+ year, Kitchin and and Wall cycles (as they fit into the context of the longer cycles):


Traders enjoy.  Please do your own analysis.  Later we may look at even shorter cycles and see if they are factors of the Wall cycle.

Monday, February 21, 2011

The week of 02-21

Took a look at the futures as the market was closed today.  With all that was going on in the ME (Libya a major oil producer in particular) the futures were red and oil up as one would expect.  Is this the catalyst to reverse the market for the time being?  Maybe we find out on Tuesday (the European markets were down today).  Interesting that CNBC had people in reporting on the ME situation all morning.  Don't worry about Libya - the Saudis have plenty of capacity to make that up (or so seems to be the party line).

As I have indicated the past couple of weeks I believe we should be at a point where we get a trend reversal.  It may only be for 4-8 weeks, but to go much higher the market needs a correction to reset expectations.  Everyone is on edge waiting for that correction and unwilling to commit more on the long side until that happens.  So in that respect a correction is viewed as a positive by the bullish.

The cycles keep topping so sooner or later we get that correction:
  • The 10 year cycle is down  (Juglar cycle - 3x the Kitchin cycle)
  • the Kitchin cycle (41 months) is down
  • the 2 year (24 month cycle) is up
  • The one year cycle is down
  • The 7 month cycle (just topped)
  • the 20 week  (Wall) cycle is down
  • the 22 day cycle is down
  • the 11 day cycle is down 2 more days
So what is keeping the market up?  The FED may interrupt the natural flow of the cycles on a temporary basis, but don't fool Mother Nature - it ain't nice.  So with all that is going on in the ME we have the perfect excuse for a cyclic downturn.

Here are the charts:


GL traders.  Do your own analysis.

Sunday, January 23, 2011

kitchin and wall cycle continued...

The Kitchin cycle at 42 months is approximately 1/3 of a 10 year cycle (3 x 42 = 126 months or 10.5 years).  If we use the Dewey cycle length instead (40.68 months) it is even closer (3 x 40.68 =  122.04 months).  So maybe the 10 year cycle is really 10.17 years? Lets look at this graphically:

Now this is interesting.  A Kitchin cycle starts about the same point as the 10 year cycle does in 2002 and ends about the same point as the 10 year cycle does in 2012.  So it appears the Kitchin cycle is 1/3 of a 10 year cycle?  Drilling down the a Kitchin third is 1/3 of a Kitchin cycle:


Drilling down further the Wall cycle (20 weeks) is 1/3 of a Kitchin Third (or 1/9 a Kitchin cycle).  See for yourself:


As a result you have the 10 year, the Kitchin, the Kitchin Third, and The Wall cycle bottoming together in 2012 (just as they did in 2002).  And this my friends does not look good for the year 2012.

Continuing this - what is 1/3 of 20 weeks.  20 weeks is 100 trading days so 1/3 is 33.33 days or what I commonly call the 33-34TD cycle.   Here is how it looks graphically:


Now 1/3 of 33 is 11.  So is there an 11TD cycle?  Lots look at a chart:


Cliff Drokes (cycle authority) claims the 30 year cycle is one of the more important cycles (3 x 10 year).  So lets summarize what we have learned.  From the Kitchin cycle using multiples of 3 or factors of 3 we have the 30 year cycle, the 10 year cycle, the 3.33 year cycle (approximately), the 14 month cycle, the 20 week cycle, the 34Td cycle and finally the 11TD cycle.  In all my reading of cycles I have never seen all these different cycles related to the Kitchin cycle this way.

Gl traders.  Your thoughts appreciated (pro and con).

Thursday, January 20, 2011

Kitchin and Wall cycles

You have been introduced previously to the 3.39 year (Dewey cycle) or 40.68 months. Others talk about a 41 month or 42 month cycles. I believe all these people are talking about the same cycle (and will assume as much) . The 42 month cycle is commonly called the Kitchen Cycle.

The Kitchin Third, as its name implies, is one third the length of the Kitchin Cycle. Since the ideal Kitchin cycle is 42 months or 1277.5 days in length, the ideal Kitchin Third is 14 months or 425.83 days (about 60 weeks).

PQ Wall (noted cycle authority) said Since a Kitchin cycle is made up of nine Wall Cycles, each Kitchin Third is made up of three Wall Cycles (or 20 weeks per Wall cycle). The Kitchin Cycle often unfolds in the three sections, but Kitchin Thirds are not typically as clear as other cycles.

Market forecasting master PQ Wall had a general rule of third last and weakest. This goes for the final Kitchin Third in a Kitchin Cycle, but also goes for Wall Cycle #3, #6, and #9, i.e, the final Wall Cycle in each Kithchin Third.

Got all that?  Maybe a couple of pictures (charts) will help make it clearer:


Now let's look at a Kitchin Third:

Disclaimer:  placement of cycles may need to be shifted slightly.  The charts are for illustrative purposes only.  Now you know why I keep talking about a 20 week cycle.

GL traders.