Tuesday, November 23, 2010

11-23 mid-week update

I told you over the week end I expected the first two days to be down.  The view for the remaining 1.5 days of the week is not real clear as we have 1 shorter cycle still to bottom and the 45 day cycle will top early next week.  There may be a chance for a short term trade on the long side if we have the market opening down tomorrow morning.  I view it as a fairly high risk trade and suggest if you take the trade you be careful and don't get greedy.....

Overall I still think Wed-Fri will be up, but given it is a holiday period trading it may be boring without a lot of movement on low vol.  The best advice may be to set stops and take Wed and Fri off.

Here is the SPY:


11-23 Looking back part III

I look back to see how I have done.  As I noted last time I looked back I don't always hit the ball.  I was too pessimistic on APPL and AMZN.  Since then APPL hit my revised target of $300.

I posted a chart of BUCY in late Oct and noted it was a buy.  This would have been a bases loaded home run.  I wish I could claim I saw a buyout coming.  I didn't.  BUCY analysis was requested by somone else.  Sometimes you get hit with dumb luck.  Still I saw it as a buy.

Another stock I covered was CREE after a pullback and noted it was a buy with an initial target of $54.  It has gotten over $58.  If I had revisited it a couple  weeks ago I feel confident I would have upped my target.  Regardless, I played calls 3 different times when CREE was in the $50-51 range for some nice profits.  If I had had the funds available I may have bought the stock.  But, between long and short positions I  did not have funds to do so.

It appears that CREE is near a top and if you own it then you should tighten your stops to preserve profits.  Here is CREE:

Have a great Thanksgiving.

Saturday, November 20, 2010

11-20 the week ahead

I told you last weekend:
 
"So this past week's move down may be reversed during the next week to a large extent (and possibly completely). I expect the first couple of days to remain weak as a couple of short cyces bottom and should turn up in the last half of the week. That implies the latter part of the week should show some upside potential."
 
Mid week I told you:

"We have had a very noticable sell down since the middle of last week, and so far no action indicating much of a bounce. But, after the past few days a bounce may be due."

I feel I was reasonably accurate for the week overall. Now I know I will not always be as accurate. I also know you expect me to try. So here goes. We should have a 5.5 day cycle top Monday before noon. We also have a couple of longer (but short term cycles) that should bottom early next week.

So I expect the first part of the week to show some weakness (maybe test the 1173 area) and then a Thanksgiving rally to start. In other words the week should be choppy with little movement by the end of the week.

Here is the SPX and 2 short cycles:

Hope all of you have a great Thanksgiving.

Wednesday, November 17, 2010

11-17 OIL cycles revisited

Called the last bottom in ETF OIL  (11/01).  So we took another look.  It appears it is ready to bottom in the next 1-2 days.  See for yourself: 

Update 10-18: CCI peeked above -100 triggering a CCI buy signal today.                                         

11-17 mid week cycle update

Based on market action the past 5 days I believe it is probable the 40.68 month cycle topped mid-week last week.  I was off by 5-6 days (so shoot me!!!).  We have had a very noticable sell down since the middle of last week, and so far no action indicating much of a bounce.  But, after the past few days a bounce may be due.

Then again it may be early next week before we get any bounce as that is when 2 shorter cycles bottom (22 day and 34 day cycles).  The 45 day cycle continues up to the end of the month.  If the 40.68 month cycle DID top then we now have 3 dominant long cycles (24 month, 40.68 month and 10 year) down.  The  one longer cycle that may provide some support is the 12 month cycle which should top around the third week of January.

IMO the sum of the cycles has now turned negative.  Time will tell.  Please do your own due diligence. Here is the SPY showing 3 of the shorter cycles:

For reference here are longer cycles mentioned above (previously posted):

https://blogger.googleusercontent.com/img/b/R29vZ2xl/AVvXsEheJWTQYU0yJd6vVLqFpkifekhK1_HF2xY_-9OTrm5XI2GXX0_Da8Axx9YWs2VPiz-tmETEw9Iy9BTuP8ZxIGYk6T_I2EzR1HiLdNdc9xyp1VkkPiK-egkghU6YLLBst4poYAI8uV-Nwyz0/s1600/1101-10yr-41-24mth.PNG

Tuesday, November 16, 2010

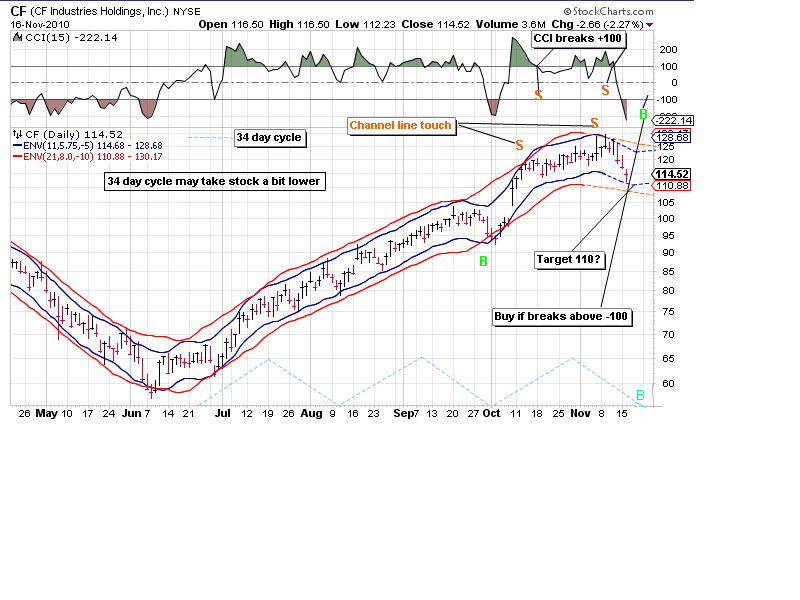
Cyclic analysis CF per request

CF is 2-3 days from the bottom of a 34 day cycle, but no buy signal yet.  There is a good chance we get signals at the bottom of this short term cycle (but not guaranteed).  I think the downside potential is $110, but it might be $108.  $108 would probably cause a channel buy signal.

Here is the short tem chart:
The longer term cycles are up, but the shorter of the two should top soon.  Here is the chart:


11-16 VIX trend change signal confirmed today

Since we first got a VIX trend change signal (closed below channel about a month ago) we had to wait for the Index (S&P) to confirm the signal.  We were waiting for 4 consecutive down days. Today was the first time we had 4 consecutive down days since the last signal.

Does this mean we go straight down.  No, it doesn't - but it should signal a period of time (several weeks or even months) of a down trending market as usually these signals are infrequent.

Interesting, that we are looking for the 40.68 month cycle to top in this time frame (Nov 19).  As I indicated in my weekend post though at the top that cycle would flatten and have reduced momentum.  So we may have already seen a top in the S&P.  Or, we may have one more push up toward recent highs. 

Here is the VIX/S&P as of market close today:


Sunday, November 14, 2010

Cycles - looking back part II

Not every call is going to be perfect.  When you are looking at an up trending marrket and the stocks that are leading the market up it is easy to over estimate the downside of any pullback.  I did that with AAPL.  Here is the chart from Oct showing my downside estimate of $290 (which was not achieved):

And for refernce here is a more current chart (and I may hve overestimated the downside again?):
And here is AMZN (another leader to the upside) - looks like I over estimated the downside potential in Oct:

And an updated chart (may be too bearish on AMZN again):

So, I won't always be right.  Still we need realize the leaders to the upside could lead to the downside if/when the trend changes and allow for that.

GL trading next week.

Friday, November 12, 2010

11-13 the week ahead as I see it


As a dominant cycle reaches a top it exerts less effect as it starts to flatten out before turning down. This means less influence on the direction of the market. It also implies that the shorter cycles should exert more influence and a larger effect on market movement. So instead of day after day after day of the market moving up with a rare down day thrown in you get fewer up days and more down days. This makes for a better short term trading environment, but it also makes timing moves trickier. You get increased volatility both up and down.

As the topping process progresses you start to get more down days than up days. Just realize though the topping process for a longer cycles can be several days (2-3 weeks or more). In other words longer cycles have a longer turn radius than short cycles so we should not expect a sharp sell off the day after a long cycle tops, but a slow start that gains downside momentum over time.

So this past week's move down may be reversed during the next week to a large extent (and possibly completely). I expect the first couple of days to remain weak as a couple of short cyces bottom and should turn up in the last half of the week. That implies the latter part of the week should show some upside potential.

As always this is the my opinion and should only be used in conjunction with your own analysis. Here is a chart showing two of the shorter cycles and how they play out next week.


UPDATE 11/15:  The http://www.chartsedge.com/ forecast looks reasonable this week (I omitted it last week because it did not look reasonable - and it wasn't)  IMO:

Defining a cycle

I think we can agree if we define a cycle as 90 days it should be 90 days  and expect it to be 90 days every time within 2-3 days.   It is not 90 days, then 60 days, then 90 days.  In other words the cycle should explain the data without altering the definition of the cycle length to explain the market movement. Not only that we should expect the cycle to have the up leg and down legs to be the same length (symetrical).

This is the correct way to define a cycle IMO.  Otherwise I can just alter things any way I want to explain the historical data.  That is not analysis, but the expression of a preconceived opinion of how the market should behave.  Others seem less rigid in their analysis:

Alice in Wonderland - 90 days is whatever I tell you it is.

http://www.safehaven.com/article/18911/90-day-cycle-looking-for-a-correction