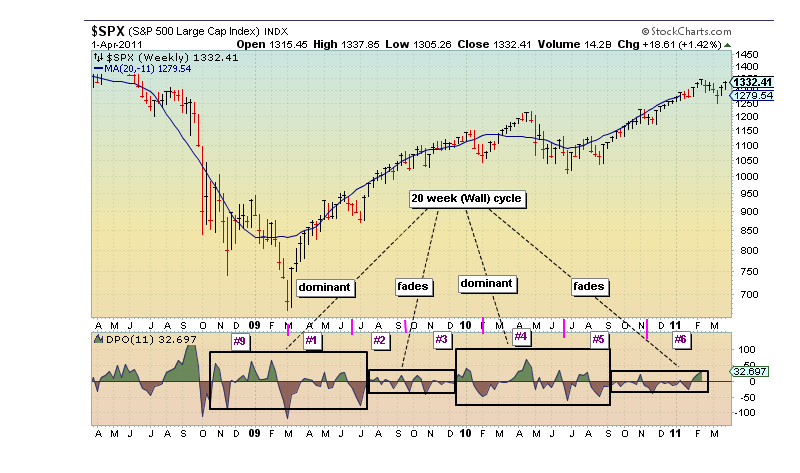
I was asked how do we measure the decay/decrease in amplitude in a cycle (or the increase as it expands). If you recall Barker talked about 3 sets of 3 wall cycles and how the 3rd of each cycle showed more downside tendency. Is that true (and how do we know)?
We look at the DPO indicator on stockcharts. We look at weekly cycles over about 3 years. Since we are looking to detrend a 20 week cycle we set the DPO parameter to 11 (see stock charts school for a complete explanation of DPO). Here are the results for the 20 week cycle. As we are into #6 (3rd of set 2) we expect the DPO values to increase (and the recent top Feb 18, bottom around Mar 16 and now bounce back may result in that - time will tell).
Here is what we see as of today:
My research into this is very preliminary, so decide for yourself. I claimed the 45 day cycle which seemed dominant last spring and summer faded later in the year. So what do we see when we detrend for the 45 day cycle? Here it is:
My research needs more work and time before I presume this is a valid way to identify the decay or growth in a cycle. At this point it is interesting and shows some potential. I leave it to you to decide if it is something you want to use.
GL traders.

c_k -- this one is for you. :>)
ReplyDeleteThanks, that helps tremendously.
ReplyDelete