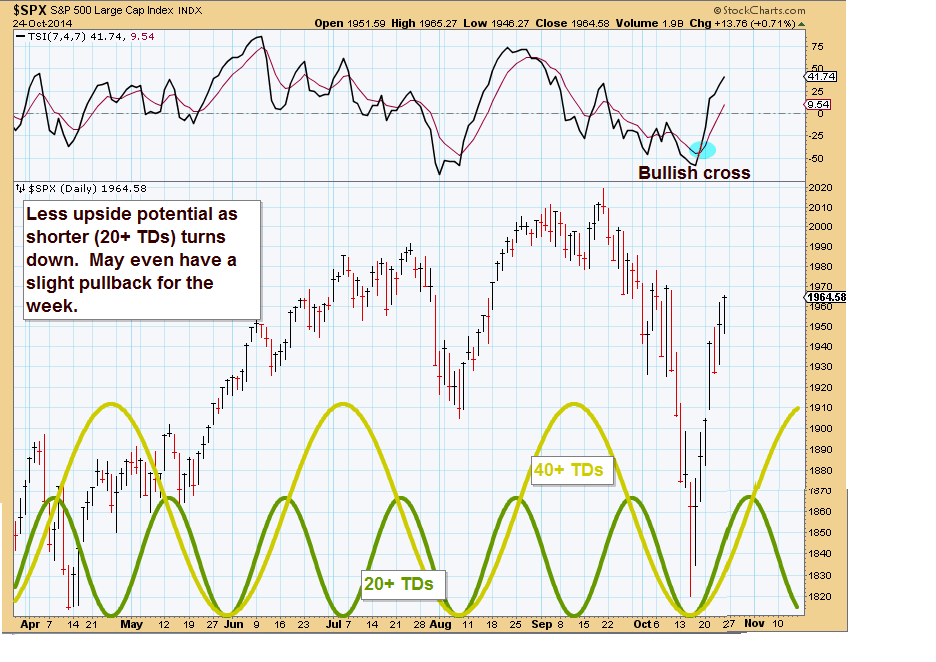
Last week I said to expect some upside from the shorter cycles. Was stronger to the upside than I expected....
This week less upside potential as shorter cycle tops and turns down.
GL traders
Cycles are a tool and should not be used to the exclusion of other tools. There is always the possibility (high probability long term) that the data will be misinterpreted or a relevant fact over looked. So use cycles to check your analysis, not as the only reason to make a decision. Interpretation is the opinion of the author and may be incorrect and should be viewed in that light.
Sunday, October 26, 2014
Saturday, October 18, 2014
Sunday, October 12, 2014
Oct 13, 2014 weekly outlook
I have shown you longer term cycles that indicated we should see market weakness and pullbacks in the Aug-Oct 2014 time frame. Even longer cycles may bottom in 2015-2016. I am beginning to believe the market is now under the influence of these longer cycles (3.5 year Kitchin cycle, 13 1/2-15 month 1/3 Kitchin cycle, 20 week Wall cycle). I have also recently shown you the 7 year Juglar cycle....
We may get an attempt to rally this week as the large banks report, but any rally will be short lived. Here is the outlook (Longer cycles now synched down):
GL traders
10/14/2014 update
An advancing market displays the characteristic of right translated cycles (longer periods advancing than falling). I have mentioned this several times over the past 4-5 years. A declining market is characterized by left translated cycles (down legs are longer in time and decline more than they advance). Usually the declines are more pronounced in a major decline than the advances were in the same amount of time. I showed you a chart recently showing major cycles advancing about 5.5 years to lose those advances to a large extent in 1.5 to 2 years. Here is the recent market - note the left translated cycles (peaks left of the center line of the cycle):
Left translation continues?
We may get an attempt to rally this week as the large banks report, but any rally will be short lived. Here is the outlook (Longer cycles now synched down):
GL traders
10/14/2014 update
An advancing market displays the characteristic of right translated cycles (longer periods advancing than falling). I have mentioned this several times over the past 4-5 years. A declining market is characterized by left translated cycles (down legs are longer in time and decline more than they advance). Usually the declines are more pronounced in a major decline than the advances were in the same amount of time. I showed you a chart recently showing major cycles advancing about 5.5 years to lose those advances to a large extent in 1.5 to 2 years. Here is the recent market - note the left translated cycles (peaks left of the center line of the cycle):
Left translation continues?
Saturday, October 4, 2014
Oct 6, 2014 weekly outlook
Last week said a short term bottom was expected. Bottom was 1 day later than expected. Recovered a substantial part of the loss from earlier in the week by Friday. Short term it appears we should see some gain first part of this week. Expect a top by Friday unless the unexpected happens in Europe, mid East or China. We could also see multiple cases of Ebola in Dallas (fear is not good for the market).
But based on short cycles expect continued volatility with market highs in latter part of week or fist of following week...
Here is a short term chart outlook:
GL traders. I expect to replenish my RWM positions by end of week...
update after close 10/07/2014
Weakness continued and buy signals failed to materialize...
Longer term charts showing weak Oct seem to be in effect.
But based on short cycles expect continued volatility with market highs in latter part of week or fist of following week...
Here is a short term chart outlook:
GL traders. I expect to replenish my RWM positions by end of week...
update after close 10/07/2014
Weakness continued and buy signals failed to materialize...
Longer term charts showing weak Oct seem to be in effect.
Sunday, September 28, 2014
sep 29, 2014 weekly outlook
This past week all the major indexes finished down. A lot of volatility. Same type of activity last time a QE was set to expire as is about to happen in October. Is this the cause of weakness and volatility? Unsure, but it does raise the question....
Looks like we should see a short term bottom by Sept 30 (+/- 1 day). Medium term look for more volatility and some weakness. Maybe we finally get a correction (-10% or more), if the FED quits flooding the economy with newly printed currency.
Here is a short term outlook:
GL
Looks like we should see a short term bottom by Sept 30 (+/- 1 day). Medium term look for more volatility and some weakness. Maybe we finally get a correction (-10% or more), if the FED quits flooding the economy with newly printed currency.
Here is a short term outlook:
GL
Saturday, September 20, 2014
sept 22, 2014 - Is it time?
take a look:
Have we topped? I have a full position RWM.
We may see a try at higher highs by mid week, but I suspect we are at/near a high:
GL
Update: 9/22 sold a tranche of RWM; hope to buy it back if R2K pops a bit.:
update sep 23
Have we topped? I have a full position RWM.
We may see a try at higher highs by mid week, but I suspect we are at/near a high:
GL
Update: 9/22 sold a tranche of RWM; hope to buy it back if R2K pops a bit.:
update sep 23
Sunday, September 14, 2014
Sept 13 weekly outlook and more
More of a downside move than anticipated, but it is what it is. I continue to hold RWM shares (R2K inverse) and have about a 1% gain at the close Friday. Because it seemed I had gotten out of sync with the market I have attempted to fix that. I hope I have. Here is that attempt:
Longer term the group of longer term cycles I have referenced in the past (Kitchin, 1/3 Kitchin and Wall cycles) seem to be coming together to provide a more protracted downturn. The Wall cycle (20 weeks, 4.5 weeks) should be at a top, the 1/3 Kitchin 13,5 months is over 6 months up from its last bottom and topping. The Kitchin cycle is well past its top and should be in the area where it goes hard down soon.
See for yourself:
How much of a pullback could we expect? I looked at the nesting of cycles longer than the Kitchin some time ago. Two Kitchin cycles make up what is called the Juglar cycle (7+ years). This cycle usually right translates and goes up 5-5 1/2 years and down 1 1/2-2 years. Last bottom was likely early 2009 (up 5+ years 2002-2007) and down late 2007 into Mar 2009). Here is an update of a chart I maintain showing the current iteration of this cycle:
If I have the timeframes correct then the Juglar Cycle should start its pullback soon and it could get nasty,
So this covers the long cycles? Hardly!!! Here are longer cycles (that I posted quite a while [2-3 years] ago and their likely placement in time (2 Juglar cycles in a Kuznet cycle):
We are overdue for a downturn (some claim FED policy has elongated some of these longer cycles by 1-2 years and if that is the case any downturn could be very fast and powerful).
GL traders
Longer term the group of longer term cycles I have referenced in the past (Kitchin, 1/3 Kitchin and Wall cycles) seem to be coming together to provide a more protracted downturn. The Wall cycle (20 weeks, 4.5 weeks) should be at a top, the 1/3 Kitchin 13,5 months is over 6 months up from its last bottom and topping. The Kitchin cycle is well past its top and should be in the area where it goes hard down soon.
See for yourself:
How much of a pullback could we expect? I looked at the nesting of cycles longer than the Kitchin some time ago. Two Kitchin cycles make up what is called the Juglar cycle (7+ years). This cycle usually right translates and goes up 5-5 1/2 years and down 1 1/2-2 years. Last bottom was likely early 2009 (up 5+ years 2002-2007) and down late 2007 into Mar 2009). Here is an update of a chart I maintain showing the current iteration of this cycle:
If I have the timeframes correct then the Juglar Cycle should start its pullback soon and it could get nasty,
So this covers the long cycles? Hardly!!! Here are longer cycles (that I posted quite a while [2-3 years] ago and their likely placement in time (2 Juglar cycles in a Kuznet cycle):
We are overdue for a downturn (some claim FED policy has elongated some of these longer cycles by 1-2 years and if that is the case any downturn could be very fast and powerful).
GL traders
Sunday, September 7, 2014
Sept 8, 2014 weekly outlook
The prior week traded in a very narrow range over the 4 trading days. It was down going in to Friday and turned positive for the week on very poor employment news. The theory seems to be slack employment will restrain the FED when it comes to raising interest rates. Still QE3 is set to wind down by October. Going to be interesting to see if the market actually reacts to this slow down in printing dollars. If so we should see reaction starting soon. Russell 2000 was little changed.
Appears market will continue sideways with a spike up during the week of 10-15 SPX points to set a top around 2020. By the end of the week probably not much change.
Here is a visual:
GL traders
Update Sep 9:
Looks like RWM forming inverted H&S pattern:
VTL (Valid Trend lines) http://sentienttrader.com/hurst-trading-room/blog/peak/
GL
Appears market will continue sideways with a spike up during the week of 10-15 SPX points to set a top around 2020. By the end of the week probably not much change.
Here is a visual:
GL traders
Update Sep 9:
Looks like RWM forming inverted H&S pattern:
VTL (Valid Trend lines) http://sentienttrader.com/hurst-trading-room/blog/peak/
GL
Monday, September 1, 2014
sept outlook - Hurst chart
Currently looks like down into third week and some recovery toward end of month.
http://sentienttrader.com/hurst-trading-room/blog/
GL traders
http://sentienttrader.com/hurst-trading-room/blog/
GL traders
Sep 2, 2014 weekly outlook
Should top (or has topped?) and begin down for next 8-9 TDs (trading days). After that maybe one more high. Taking more time than expected to top and give us a respectable pullback.
Picked up small amount of RWM (R2k Inverse) - 200 shares - last week. Will add if expected pullback starts. Currently around break even.
Subscribe to:
Posts (Atom)


