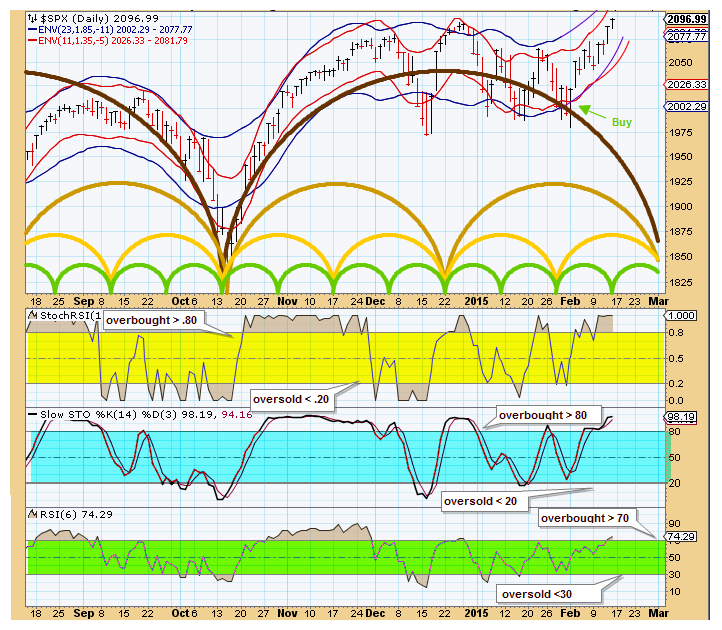
My expectations were off the mark the week ended Fed 13 as the market moved up Tue-Fri to new highs. This is why we use Stop and limit orders - to protect ourselves when we get it wrong.
Looking at 3 indicators they seem to indicate we are in an over bought market. Now, this does not mean an immediate pull back as sometimes we stay over bought (or over sold) longer than we anticipate. Still I expect some sort of pullback during the week and into the end of the month. Given recent volatility 2-3% would probably be reasonable.
GL traders

Thanks! So the cycles go down in March 15.
ReplyDeleteAlso have a look at this.
http://marketchartpattern.com/indices/sp-500-dow-jones-nasdaq-new-york-stock-exchange-composite-markets-14-feb-2015/
Thanks for the URL reference. Short week (4 days) so may see a turn by end of week, but it does appear we should expect some downside by late Feb / early Mar.
ReplyDeletethanks, normally seasonality favour higher prices in Feb, pullback is possible.
ReplyDeleteMoz - nothing is ever certain in the market. We look at charts, indicators and cycles trying to gain an edge.
DeleteTrue that!
ReplyDeleteThe Economic Cycle Research Institute, which maintains its forward looking Weekly Leading Index to peer around the corner of the economic cycle and divine what lies ahead, has fallen to levels not seen in three years — a level that, outside of the current economic expansion, has only been seen seven other times since the 1970s.
ReplyDeleteHere's the rub: Six of these marked the start of recessions.
pardon the question but Sat. and Sun are not included in your count?
ReplyDeleteGenerally I label shorter cycles as "xx TDs" - where TDs is short for "Trading Days". Sat/Sun are not market days so they provide no data for our charts/indicators..
ReplyDelete