shorter cycles (10 weeks and 5 weeks) cycles set to bottom. March should show some upside strength.
The mother of all cups/handles
GL traders
Cycles are a tool and should not be used to the exclusion of other tools. There is always the possibility (high probability long term) that the data will be misinterpreted or a relevant fact over looked. So use cycles to check your analysis, not as the only reason to make a decision. Interpretation is the opinion of the author and may be incorrect and should be viewed in that light.
Sunday, February 25, 2018
Saturday, February 17, 2018
Week of Feb 20, 2018 outlook
10 week cycle turning down; 9 month cycle down. 5 week cycle up, 20 week cycle up
I told you last week RSI break above 30 was a positive indicator
GL traders
I also told you about Money Flow as an indicator.
GOLD
I told you last week RSI break above 30 was a positive indicator
GL traders
I also told you about Money Flow as an indicator.
GOLD
Friday, February 9, 2018
Feb 12, 2018 weekly outlook
Appears the correction not completed yet as 9 month cycle still close to the top. Also, a couple of shorter cycles should keep the push down going near term.
GL traders
RSI cross above 30 is a positive signal.
Gold and Silver:
GL traders
RSI cross above 30 is a positive signal.
Gold and Silver:
Sunday, February 4, 2018
Saturday, February 3, 2018
Sunday, January 28, 2018
Saturday, January 20, 2018
Monday, January 15, 2018
Friday, January 5, 2018
Money flow signals
How to use money flow to give trading signals....
Crossing MF zero line should be watched for. Cross from below is money flowing into the stock/index. But moves near the zero line can whipsaw you in/out on minor moves up or down resulting in no gains or losses. so wait for 0.05 above or below the zero line to act.
You may want to use MF to confirm other signals. This year I will try to introduce you to other technical signals you may want to use. I will try to keep it simple (you can do additional research).
GL traders
Crossing MF zero line should be watched for. Cross from below is money flowing into the stock/index. But moves near the zero line can whipsaw you in/out on minor moves up or down resulting in no gains or losses. so wait for 0.05 above or below the zero line to act.
You may want to use MF to confirm other signals. This year I will try to introduce you to other technical signals you may want to use. I will try to keep it simple (you can do additional research).
GL traders
Thursday, January 4, 2018
2018 outlook
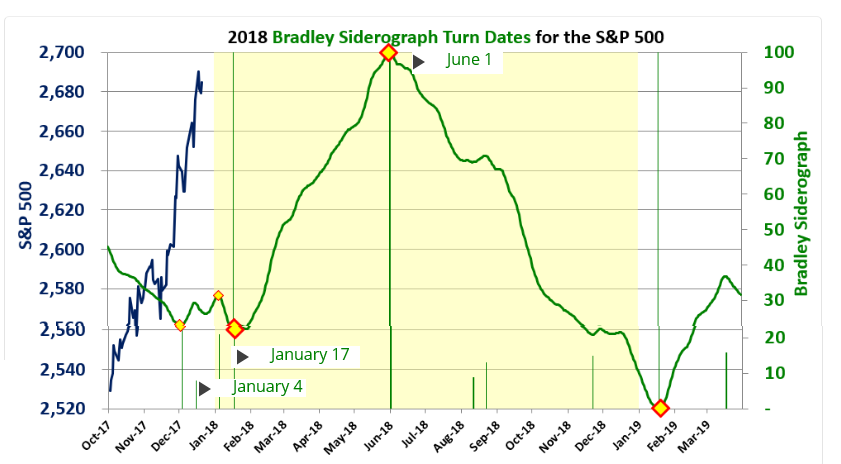
Yearly high in June? Here is the Bradley Siderograph:
The circle/cycle outlook:
Both the Siderograph and the circle cycle graph show a parabolic move up. This often happens (bubble) before a market correction.
GL traders
.
The circle/cycle outlook:
Both the Siderograph and the circle cycle graph show a parabolic move up. This often happens (bubble) before a market correction.
GL traders
.
Subscribe to:
Posts (Atom)