
Tuesday, January 24, 2012
01-24-2012 comment
It appears the short 17-18 TD cycle in December was not a true cycle inversion, but a transition to a new dominant cycle (34TD to 45TD). If this proves out we are now set up for some downside. So lets see what the market gives us.
 GL

Thursday, January 19, 2012
01-20-2012 outlook
So far we have had many of the major financial/banks report. Seems to me that the results were very mixed. WFC and a couple of larger regionals (BBT, USBancorp) looked good, the rest not so good. I don't see this as a strong signal the economy is ready to soar. Amex reported this evening and missed on revenues (a mixed report).
We got a slew of techs reporting after the close. Seems the MSM is pumping it as a strong showing. Seemed rather so-so to me. IBM missed on revenues. INTC beat on revenues and earnings, but had lowered expectations earlier. MSFT was pretty much in line. GOOG laid an egg. In December ORCL had a notable miss. Again - not the type of showing of a booming economy.
So we have financials with mixed results and techs with so-so results. Not the booming economy some want us to believe. These are two large sectors of the economy and I suspect the market on inflated expectations has gotten ahead of reality. We will see.
Here is the SPX outlook:
 GL traders. Nothing goes one way forever. Sold the last of my trading longs today, so I am now short and cash. The VIX broke 2 std deviations (47.5%) below its Nov 1 high - so 3 consecutive down days (as if that will ever happen again - hehehe) would signal a trend change.
We got a slew of techs reporting after the close. Seems the MSM is pumping it as a strong showing. Seemed rather so-so to me. IBM missed on revenues. INTC beat on revenues and earnings, but had lowered expectations earlier. MSFT was pretty much in line. GOOG laid an egg. In December ORCL had a notable miss. Again - not the type of showing of a booming economy.
So we have financials with mixed results and techs with so-so results. Not the booming economy some want us to believe. These are two large sectors of the economy and I suspect the market on inflated expectations has gotten ahead of reality. We will see.
Here is the SPX outlook:

01-19-2012 outlook
We should be at or very near the top. There is a FIB level at 1310.33 which may well mark the top. The 35TD cycle DPO (amplitude) is close to being fulfilled. Other TA indicators are also indicating an imminent top. Money Flow has ticked down and this normally happens just prior to a top. RSI is approaching extreme levels. Here is the big picture:
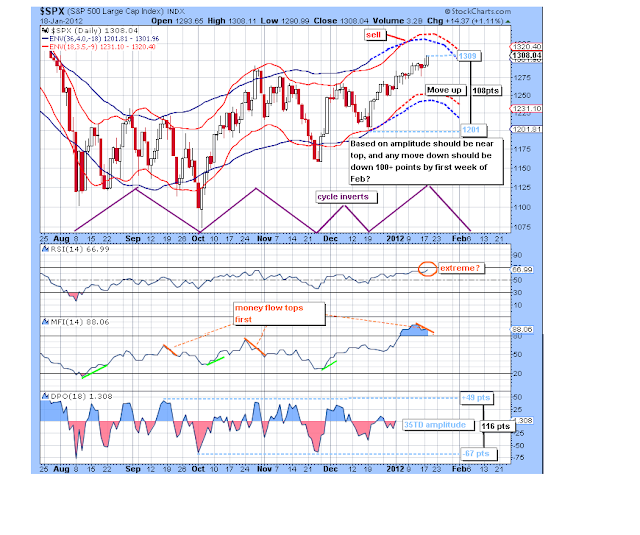 We have already gotten a sell signal from crossing channel lines. Now this may have been a bit early, but in my opinion a signal should precede the event (topping in this case) to allow the trader time to consider and act. Nothing is certain when it comes to the market so we may see marginally higher highs. We have a shorter cycle topping tomorrow during the day and this should result at least a testing the 1310.33 FIB and may spike above that, but by Friday we should start our descent. See for yourself:
 GL traders. Hope I am back in sync with the market.


Tuesday, January 17, 2012
01-18-2012 outlook
I have been searching for an explanation of the data in terms of cycles for weeks now. I was looking at David Knox Barker's recent depiction of the Wall Cycle:
 OK, so this explains it - sort of. The thing that caught my attention was the short QW3 cycle at the end of November and early December. This had always been difficult to explain. It is about half the other cycles. If you do much research on cycles you will find some cycle analysts talk about cycles inverting. In my experience this is not a common occurrence, but I do not discount the possibility. We were going along with cycles averaging about 33-34TDs and we get a 17TD cycle. This shifts the cycle tops and bottoms 1/2 a cycle and the top is where we had projected a bottom and the bottom is where we had projected a top. In other words the cycle had inverted. Here I show that:
 If Barker's interpretation is correct and we had a cycle inversion (as it appears we did) then we should be topping and head down into early February. GL traders.


Monday, January 16, 2012
the week of Jan 17 2012
I wish I could get a clearer reading on what is happening in the market. At this time though I find no cycle combinations that seem to explain the market action. Doesn't mean there isn't an explanation, just means I am unsure of what it is. January is starting out the year showing strength (same as last year) - so maybe there is a one year cycle in play. No high level of confidence in that.
Based on my cycle work I believed we would have topped by now (and maybe we did Friday?) and be showing weakness. It seems we have achieved the levels (or more) one would expect from the amplitude of the DPO. The CCI seems to be indicating a possible top. Some other technical indicators like the MFI are also at extremes.
So what would it take to turn the market. I suppose a bad report from a major company like IBM (the model of consistent performance) which has a new head that decides to do some house cleaning might do the trick. All we can do is wait and see.
GL
Based on my cycle work I believed we would have topped by now (and maybe we did Friday?) and be showing weakness. It seems we have achieved the levels (or more) one would expect from the amplitude of the DPO. The CCI seems to be indicating a possible top. Some other technical indicators like the MFI are also at extremes.
So what would it take to turn the market. I suppose a bad report from a major company like IBM (the model of consistent performance) which has a new head that decides to do some house cleaning might do the trick. All we can do is wait and see.
GL
Spiral dates top
Spiral dates says Jan 14 ideally will mark a top.
http://spiraldates.com/2012/charts/sp500_010612A.png
http://spiraldates.com/2012/charts/sp500_010612A.png

Sunday, January 8, 2012
The Jugular/Kitchin cycles bottom 2012
This is a preview of the coming K-Wave winter?

http://www.financialsense.com/contributors/chris-ciovacco/2012/01/06/yields-cycles-sentiment-say-gains-may-not-last
http://www.financialsense.com/contributors/chris-ciovacco/2012/01/06/yields-cycles-sentiment-say-gains-may-not-last
01-09 outlook for the week
We should have a longer multi-week cycle bottoming by the end of the week. We have two multi-day cycles that appears will bottom by Thursday close. We have a short cycle up two days then down two days into Thursday close. For the week expect a low Thursday with a bit of recovery on Friday.
Here is the SPX:
 Gl traders
Here is the SPX:

Thursday, January 5, 2012
Always question everything.
I like David Knox Barker and his work. I have repeatedly talked about the Kitchin and Wall cycles. The one thing that bothers me about the Wall cycle (and his interpretation) is the variability he claims it has. That can lead to a lot of personal bias and interpretation. He gives a "typical" range of a Wall cycle of 8-32 weeks (that is a lot of range and leads a lot of room for personal biases/interpretation).
Now I believe we should interpret the data not insert our preconceived personal biases into our analysis. So I have been thinking about this interpretation for a while and whether it is useful in interpreting the data. I have come to believe it is of limited usefulness. So I have looked at the data (several times) to see if there is an alternative interpretation to better explain the data. Terry Landry of T-Theory seems to favor a 15 week cycle. There are 12 - 15 week (12 x 15 - 180 weeks) periods in a 42 month (Kitchin - 3 years 6 months or 3 X 52 + 26 = 182 weeks) cycle. Here is a chart showing these 15 week cycles:
 Seems to me this interpretation offers a more acceptable level of variability in cycle length than the 20 Week Wall cycle. It still points to a low in mid January. Always question everything/everybody and focus on whether the market data supports the interpretation. Your feedback can help keep me on track....
Now I believe we should interpret the data not insert our preconceived personal biases into our analysis. So I have been thinking about this interpretation for a while and whether it is useful in interpreting the data. I have come to believe it is of limited usefulness. So I have looked at the data (several times) to see if there is an alternative interpretation to better explain the data. Terry Landry of T-Theory seems to favor a 15 week cycle. There are 12 - 15 week (12 x 15 - 180 weeks) periods in a 42 month (Kitchin - 3 years 6 months or 3 X 52 + 26 = 182 weeks) cycle. Here is a chart showing these 15 week cycles:

Monday, January 2, 2012
01-03-2012 outlook
How do we start the new year? The evidence suggest we start the new year by pulling back the first few trading days and set a bottom by around Jan 11.
Tuesday could well kick off the down side move. Here is the SPX and my interpretation of the cycles:
 GL traders. May 2012 treat you kindly.
Tuesday could well kick off the down side move. Here is the SPX and my interpretation of the cycles:

Subscribe to:
Posts (Atom)