Friday, May 31, 2013

May 31 Hindenberg Omen

[1] The daily number of NYSE new 52 week highs and the daily number of new 52 week lows are both greater than or equal to 2.8 percent (this is typically about 84 stocks) of the sum of NYSE issues that advance or decline that day (typically, around 3000).  Check and check....


[2] An older version of the indicator used a threshold of 2.5 percent of total issues traded (approximately 80 of 3200 in today's market).  Check.

[3] The NYSE index is greater in value than it was 50 trading days ago. Originally, this was expressed as a rising 10 week moving average, but the new rule is more relevant to the daily data used to look at new highs and lows.  Check

[4] The McClellan Oscillator is negative on the same day.  Check


[5] New 52 week highs cannot be more than twice the new 52 week lows (though new 52 week lows may be more than double new highs). Check

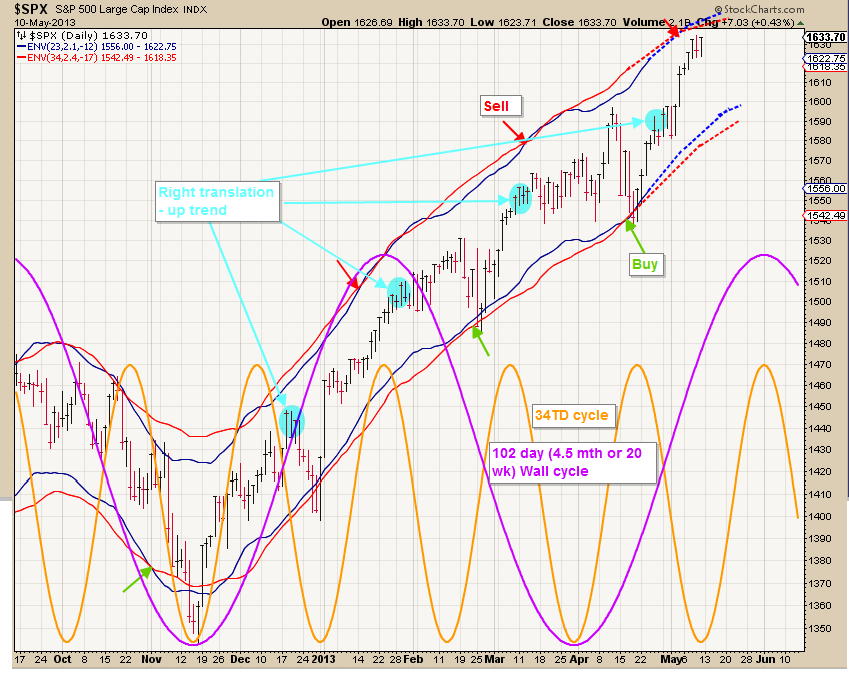
Last time we got an Omen was mid April which was followed by a minor pullback of 3-4%.

Tuesday, May 28, 2013

May 24 market update

As I explained to you over the week end we should expect short (choppy) moves up and down since we were in a time period where we expected longer cycles to top. 

Specifically - the Wall cycle (20 weeks/102 days/4.5 months) should top.  The Wall cycle bottomed Nov 19, 2012 and again 4.5 months later (Nov-Mar 4.5 months = 1 cycle).  Then half a Wall Cycle to a top is 2 months 1 week  (which is early June). Then there is the 1/3 Kitchin cycle which is 13 months long  (bottom Nov 19 + 6.5 months to the top is early June).

With these 2 longer cycles topping (flattening) the shorter cycles have more influence.  This is what we are seeing as we get short (time periods) moves up and down,  This is the movement I told you to watch for.  I also told you to watch indicators like short term RSI for direction changes (short term trades).  Here is what I am seeing:


No change - short choppy moves (up, down, up, down) - EOD:


Wed May 29 - Market selling down after an up Tue:


The market continues short choppy moves up/down.....

EOD May 30  - choppy up/down continues ( as top is formed in my opinion):


May 31 - Market fulfilled down as projected.  (and a point or two more)....

Sunday, May 26, 2013

June 2013 outlook

Did we set a top last week (May 20-24) or was it just the first step in making a top.  My longer term outlook for the year suggests one more up thrust.  My guess is it fails to set a higher high completing the topping process the first week of June. Here is my 2013 outlook updated with data thru May 24:


So we set a top the first week of June and sell off the remainder of the month (at least most of the month).  Zooming in and looking at 2 shorter cycles we see that the current pullback is the result of a 12-13TD cycle bottoming.  The turn up by this shorter cycle should help the market to retest the high in 6-7TDs (or so I believe).  Here is a visual:


Longer term look back:


Sunday, May 19, 2013

May 19 outlook

Evidence suggests the market should continue up next week, but we may see topping action soon (up/down/up/down with minimal upside progress).  We could see a top as early as May 28 (moon phase), but It could be as late as June 7-10 (with any cycle right translation but), to keep it short we should see a top soon.

The RWM (Russell 2000 short ETF) suggests a top by around May 28 as it bottoms.


 SPX on the other hand suggests a top a bit later (first week of June?).


In summary - top between last week of May or first week of June.  Watch your short term trading indicators (for example RSI (3))....

May 20 EOD:


Up, down, up, down.....


Down, up, down?


Friday, May 17, 2013

May 17 - gold outlook

Gold has been heading toward last months low and should test it as suggested in early May.  The current target according to the DPO estimate is 1325-1330 by or before May 28.  Time will  tell, but that is the time frame for the 23TD and 34TD cycle bottoms.

Here is a visual:


Wednesday, May 15, 2013

May - week of 12th (may 15 update)

Longer term cycles show up trend continuing into at least 2nd week of June.  Of course tops in an up trending market are  usually right translated as the up leg is longer in time than down legs (shorter in down trending markets and left translated).  So target date for a significant top is around June 10, but may be later because of translation...  Here is a visual:


Currently the longer cycles (ie Wall cycle) are  trending up, but we have some shorter cycles (ie 34 TD - 1/3 the Wall cycle) is down this week.  So we may get some downside pressure, but it  will be partially offset by the up trending longer cycles.  So be careful.  Here is a visual:


May 15: Shorter cycles continue to be right translated as the trend continues to be up (this is to be expected).  Any pullbacks (counter trend) are shallow and short (to be expected).  So the shorter cycles are about 5 days up and 3-4 days down....  I expect this will continue into June.  Here is a visual:


Was today's midday reversal a short term top (right translated - top expected by Monday?):


May 16 EOD - seems we turned today, about 3 days later than projected top as shorter cycles continue to be right translated (means down leg probably will be short and shallow).  As OPEX ends tomorrow we should not be surprised to see a low by EOD Friday:


Friday, May 10, 2013

May 2013 gold outlook - update May 10

We got a dead cat bounce off a bottom.  Is it a final bottom?  Hard to say, but it looks like gold is ready to pull back again and possibly test the bottom.  Here is a chart of GLD:


GL

5/10 3:17 pm EDT Today gold took a hit as interest rates went up and the dollar went over 100 Yen. Take a look:


This seems to  be a possible test of the recent lows?

05/13 - Question - do gold and silver move in concert?


Thursday, May 9, 2013

May 2013 outlook update May 09

Updated my yearly outlook chart to include April's data.  Looks like the market is tracking the annual outlook fairly well.  If it continues expect May to be up with a top in early June (start of week 2 in June).

Here is  the updated chart:


Shorter term we have short cycles (23TD and 34TD) topping Thur-Mon May 9-13.   After that expect some weakness, but wait to sell in June because May is too soon. Here is a short term look:


GL

09:45 am EDT - looks like we may be ready for a pause:


03:20 pm EDT - I suggested we should turn as early as Thur 05-09.  Unless we get a turn up the next 40 minutes that is what we are getting.  Here is a visual: