
Wednesday, November 10, 2010
11-10 CSCO cycle analysis
CSCO reported - earnings looked OK. As usual Chambers provided very conserative/reserved guidance. AH CSCO sold down. So what do the next few days hold? If we look to buy then when? Hopefully cycle analysis will provide a clue. Here is a chart with annotations:
 Looks like a 10-15% correction but not over the cliff.
Tuesday, November 9, 2010
11-09 mid week cycles update
As we indicated on the weekend with the 5.5 day cycle turning down on Monday we might get a pullback. We actually expected a green open Monday (didn't get that) and a pullback in the last half of the day. So maybe the 5.5 day cycle will bottom by midday tomorrow. In any case - it should bottom by the end of the day. This will reduce down side pressure Thu/Fri....
Still the 22 day cycle and 34 day cycle will be down thru the end of the week. The 45 day cycle is up. So Thu/Fri should be a battle between the 5.5 day cycle plus the 45 day cycle and the 22 day cycle plus the 34 day cycle. Uncertain which of the shorter cycles will prevail - my guess is we end the last 2 days of the week without much progress up or down. If there is a tie breaker it is the longer cycles (which are up) and we move up some the last 2 days of the week.
Here is the SPY (which I use as a market proxy):

Monday, November 8, 2010
Cycles - looking back Part I
Do cycles work? That is a question you need to ask and answer for yourself. Now at times I will miss or misinterpret something. I have before and I will again. If I have it wrong now you will know within the next month or two.
Still, I have told you for now if you are a trader to buy the dips and sell the rips. I have furnished charts showing this and at times showing the next potential dip (or rip). So far that has been a winning strategy.
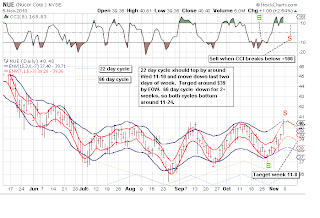
I have also posted charts of individual stocks that I was interested in or had a request to post. Around Oct 21 I posted a chart on NUE showing it was about to bottom. The lower channel lines I projected suggested a bottom around $37. I believe the actual bottom was $37.02. It the turned around and is now over $40.
Here is the chart I posted then:
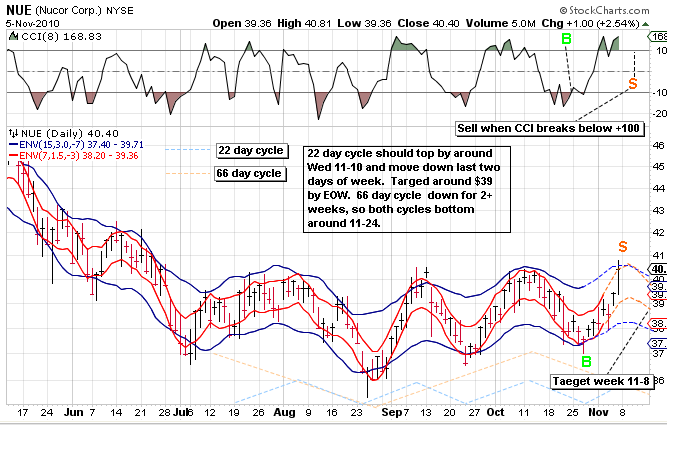
 So what about NUE now? The evidence suggest it is topping and should turn down. Here is the chart with annotations (sorry for the spelling on the chart):
We also posted charts on INTC around 10-22 and the cycles suggested a longer term cycle was up (and would continue up for a while). Here are charts then and now:

 In these 2 cases it looks like the cycles worked well. I assure you that is not always the case (usually due to analyst error).
We will review other calls later in the week.
Still, I have told you for now if you are a trader to buy the dips and sell the rips. I have furnished charts showing this and at times showing the next potential dip (or rip). So far that has been a winning strategy.
I have also posted charts of individual stocks that I was interested in or had a request to post. Around Oct 21 I posted a chart on NUE showing it was about to bottom. The lower channel lines I projected suggested a bottom around $37. I believe the actual bottom was $37.02. It the turned around and is now over $40.
Here is the chart I posted then:

We also posted charts on INTC around 10-22 and the cycles suggested a longer term cycle was up (and would continue up for a while). Here are charts then and now:


We will review other calls later in the week.
Sunday, November 7, 2010
Using the VIX for trend change signals
Many follow the VIX for potential trend changes. Often they use Bollinger Bands (2 std deviations) to track extreme moves. 2 standard deviations is 95% move off a bottom or 47.5% off a top. But using that alone tends to give false signals.
So I approach it a little differently. I use MA envelopes with the envelopes 12% above and below the MA. If the $VIX closes above the upper band then you have a potential trend change from down to up (remember the $VIX moves opposite the market). For confirmation I want 4 consecutive up days. If the $VIX closes below the lower band then you have a potential trend change from up to down. Again we need confirmation - 4 consecutive down days.
We have had a close below the lower channel over 3 weeks ago, but are awaiting confirmation of 4 consecutive down days to declare a VIX signaled trend change to down.
See for yourself:

Saturday, November 6, 2010
11-07 cycles weekend update
Monday by around 12:00-1:00 pm we should have a 5.5 day cycle turn down. This (along with one other shorter cycle down) may give us a pullback into Wednesday close. I do not expect it to be more than a moderate pullback of 15 or so S&P points. Here is a chart showing 2 short cycles:


Longer term we have a 40.68 month (3.39 yr) cycle set to top in 2 weeks around Nov 19. This will lessen upside momentum and in December may even add to downside pressure. In mid January we have a 1 year cycle topping and turning down. We also have a 2 year cycle down into May. So sideways to a bit up thru November, sideways to a bit down in December. Then we get a sizeable downturn starting mid to late January which will last into early to mid May.... Here is a how it looks visually the next 2-3 months.

Wednesday, November 3, 2010
Individual stocks
I generally do not reccomend specific stocks. I have charted a few based on requests (INTC, NUE, BUCY, OIL) and offered comments, but I assumed that the individuals requesting had done their own research and DD.
If you want specific ideas say for gold, silver, oil, biotech, and an occasional tech try KLIGUY's blog (see my blog list). He has a large following that often make reccomendations in comments. I cannot personally vouch for these reccomendations so you will need to do your own research. I am sure there are many other sites that make specific reccomendations.
My goal is to try and keep you aware of the probable market trend so you trade with the trend not against it. You will still need to come up with your own specific investment ideas generally.
11-3 mid week update cycles
Not much has changed since the weekend. Sure we had an election. Sure the Fed announced QE. Yet, not much difference in the market. The 5.5 day cycle (shown in my weekend post) should have bottomed today. The 5.5 week (think 34 days) cycle is still down. The 45 day cycle should have turned up. The 22 day cycle is up.
Let's summarize:

Let's summarize:
- 5.5 day cycle up
- 22 day cycle up
- 34 day cycle down
- 45 day cycle up

Tuesday, November 2, 2010
What could change the trend/sentiment (cycle)?
I have done the analysis. I have an opinion on what the market will do. So I ask myself - what are the catalysts that will cause the market to change. Cycles don't happen in a vaccuum.
So here is a list of things we will (may) see in the next couple of months:
Feel free to add to the list under comments. I am sure there are many I never though about.
So here is a list of things we will (may) see in the next couple of months:
- Fed starts monetizing debt (QE2)
- GM IPO set for Nov 18
- 99ers run out of unemployment benefits in December (big time) http://finance.yahoo.com/news/Congress-Next-Big-Issue-How-cnbc-1362708062.html?x=0&sec=topStories&pos=main&asset=&ccode=
- Possibly a huge tax increase in January
Feel free to add to the list under comments. I am sure there are many I never though about.
Monday, November 1, 2010
Cycles - another's views
Here is a current article on cycles: http://www.safehaven.com/article/18778/larger-uptrend-firm-into-2011-minor-top-set-for-mid-november
It differs from my analysis, but that is good in that it requires me to recheck my analysis. Areas of disagreement are:
 Of course he could be right and I could be wrong - time will tell. In his 180 day wave (1 year cycle) I believe his channels are overly generous and his projections high. I have drawn in a tighter channel that I believe to be a better representation:
 Here is my charts with annotations:


Note: I have positioned the 2 year cycle differently.
You might ask why do I think the 1 year is not dominant? Or the 4 year? It is not just me that thinks that. Check out this site:
http://gann.su/book/eng/Daniel_Ferrera_Outlook_2010.pdf
Here is an excerpt of what he says:
"10-Yr, 41-Month & 24-Month CyclesAs discussed on pages 17-18 of the 2009 outlook, we cannot overlook the importance of the 10-year, 41-month and 24-month cycles when it comes to forecasting the general trend and direction of the stock market. The influence of these 3-cycles often predominates the entire trend when looking at 5-year sections of the market. There are of course other cyclic influences, but these 3 can never be ignored. The chart on the following page is very similar to the 100-year pattern shown (1909-1910) on the prior page and is also indicating a steadily declining market from Fall 2009 (Sept-Nov) into the season of Fall 2010 (Sept-Nov). Thus far, all indications are basically saying that the market is cyclically weak and both cycles and periodicity patterns indicate that the best buying opportunity for 2010 does not occur until very late in the season, most likely not until October or November.
Gann also stated that Bear markets often run 5 years down – the first move 2 years down (10/07 to 3/09), then 1 year up (2009), and 2 years down again (anticipating a Low in 2012), completing the 5-year downswing."
Now to wrap it up here is a projection based on the 24 month, 41 month (3.39 years) and 10 year cycles:


Now you have both views and can decide.
It differs from my analysis, but that is good in that it requires me to recheck my analysis. Areas of disagreement are:
- I do not view what he refers to as a 180 day wave (1 year cycle) as a dominate cycle
- I believe his positioning of the 360 day wave (2 year cycle) is incorrect
- His 4 year cycle leaves me wondering (the 4 year cycle is not dominant)


Note: I have positioned the 2 year cycle differently.
You might ask why do I think the 1 year is not dominant? Or the 4 year? It is not just me that thinks that. Check out this site:
http://gann.su/book/eng/Daniel_Ferrera_Outlook_2010.pdf
Here is an excerpt of what he says:
"10-Yr, 41-Month & 24-Month CyclesAs discussed on pages 17-18 of the 2009 outlook, we cannot overlook the importance of the 10-year, 41-month and 24-month cycles when it comes to forecasting the general trend and direction of the stock market. The influence of these 3-cycles often predominates the entire trend when looking at 5-year sections of the market. There are of course other cyclic influences, but these 3 can never be ignored. The chart on the following page is very similar to the 100-year pattern shown (1909-1910) on the prior page and is also indicating a steadily declining market from Fall 2009 (Sept-Nov) into the season of Fall 2010 (Sept-Nov). Thus far, all indications are basically saying that the market is cyclically weak and both cycles and periodicity patterns indicate that the best buying opportunity for 2010 does not occur until very late in the season, most likely not until October or November.
Gann also stated that Bear markets often run 5 years down – the first move 2 years down (10/07 to 3/09), then 1 year up (2009), and 2 years down again (anticipating a Low in 2012), completing the 5-year downswing."
Now to wrap it up here is a projection based on the 24 month, 41 month (3.39 years) and 10 year cycles:


Now you have both views and can decide.
Sunday, October 31, 2010
Oil short cycles
I have used the Ipath ETF OIL as a proxy for oil to show the short term cycles. It appears oil should have a short term bottomsoon (within 2 days). At that time IMO it should present a nice trading opportunity. See for yourself:
 Nobody cares as much about your momey as you do - so be sure to do you own analysis.

Subscribe to:
Posts (Atom)