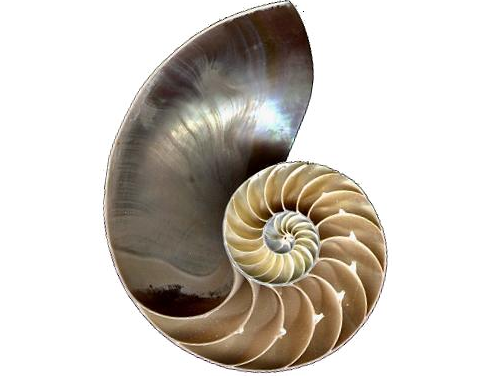
HALF SECTION VIEW OF A NAUTILUS SHELL. Successive increments of growth are united by a constant common ratio of expansion. An example of a spiral found in nature... See the above referenced article for more information on stock market cycles and their use in stock pivot point identification.
Below is a rough approximation of the spiral referenced in my last post. We should see a significant top soon (see spiral below).

Hope you find the referenced article as informative as I did.
GL traders
hi, could you please kindly let me know how you derived the possible turn / top at Oct 2012. Thanks
ReplyDeleteSee prior post. Fib series 1,1,2,3,5,8,13,21,34. 1987 to 2000 was the fib # 13, 2000-2008 was the fib #8, 2008-2013 was fib #5. Looking at the SPX chart I found the top for 1987, 2000, 2008 (Oct 2007). From that last top I projected out 5 years (the next fib in a declining sequence) which is Oct 2012.
ReplyDeleteI did some other work to try and validate this (see the referenced article) and it seems to fit.