
Sunday, October 31, 2010
Oil short cycles
I have used the Ipath ETF OIL as a proxy for oil to show the short term cycles. It appears oil should have a short term bottomsoon (within 2 days). At that time IMO it should present a nice trading opportunity. See for yourself:
 Nobody cares as much about your momey as you do - so be sure to do you own analysis.
Week of 11-01-2010 short cycles
You have a couple of shorter term cycles down next week. This is in an environment where longer cycles are up and seem to be dominant. Still these shorter cycles could give us some downside potential (say 15-20 S&P points during the week). See for yourself:

NOTE: the $cpce may be signalling a pullback also (see chart).
On the other hand the forcast produced by ChartsEdge.com for the week is tilted bullish:
 So I suggest you be careful. You can probably buy drops and sell pops, but expect modest profits as the market could be slightly higher or slightly lower by the end of the week, but probably will not make any large moves.

NOTE: the $cpce may be signalling a pullback also (see chart).
On the other hand the forcast produced by ChartsEdge.com for the week is tilted bullish:

Saturday, October 30, 2010
The longer term outlook
If you have followed my posts you know I expect a 3.39 year cycle to top around Nov 19. This is 40.68 months (commonly referred to as a 40 month cycle). There is a 24 month cycle that tops/bottoms alternately in April each year (recall the top in April this year?). These 2 cycle could be the dominant cycles over the next year.
I have tried to give you a visual of these cycles and how the align during the next few months....
 As you can see the top of the 40 month cycle is upon us and ready to top and reverse to the downside. The 24 month (2 year) cycle is already down and should bottom in April 2011. So starting in December the cycle environment should reverse the current trend. Note: This does not adress shorter cycles like the 45 day cycle which should have bottomed and will be up throughout November and down in December.
So what is the combined effect of these 2 dominant cycles: I have tried to give you a visual of the expected impact...

As you can see the combined impact of these two cycles should be "bear" friendly in 2011 and even into 2012.
I have tried to give you a visual of these cycles and how the align during the next few months....

So what is the combined effect of these 2 dominant cycles: I have tried to give you a visual of the expected impact...

As you can see the combined impact of these two cycles should be "bear" friendly in 2011 and even into 2012.
Thursday, October 28, 2010
Why cycles?
Why cycles? In nature and the universe we are surrounded by cycles. There is day and night. There are low/high tides. Days of the week. Lunar cycles (just over 29 days). There are years. There are seasons usually divided by shortest day of the year, longest day of the year and soltices.
There are man created cycles (tax season, back to school, holiday season, vacation season, etc). All these things come in to play. Many are documented in the Stock Trader's Almanac.
I have not even begun to touch on cycles some use like planet alignment and other more esoteric things used by people like Arch Crawford. Many of these things I don't claim to understand and are beyond the scope of what I am trying to convey.
An open question is - how about government or Fed interference? I believe actions by these bodies can impact cycles. They can contribute to a cycle or suppress a cycle, but they can't totally eradicate a cycle. I think we can agree that the probability of QE by the Fed has supported the current market uptrend.
Then there is POMO. What is the purpose of POMO? When will it cease? I have a theory. There is a big IPO coming - GM. Now if you have followed my prediction I have said I expect the 3.39 year (a dominant cycle) to top around Nov 19. Guess when the GM IPO is scheduled - Nov 17-18. Coincident? I don't know, but I find it interesting. I think the GM IPO will mark the end of POMO. Of course, this is a theory and time will tell.
Just for fun I charted the last two days and show high tides. Does it prove anything? Probably not, but I am betting you find it interesting.


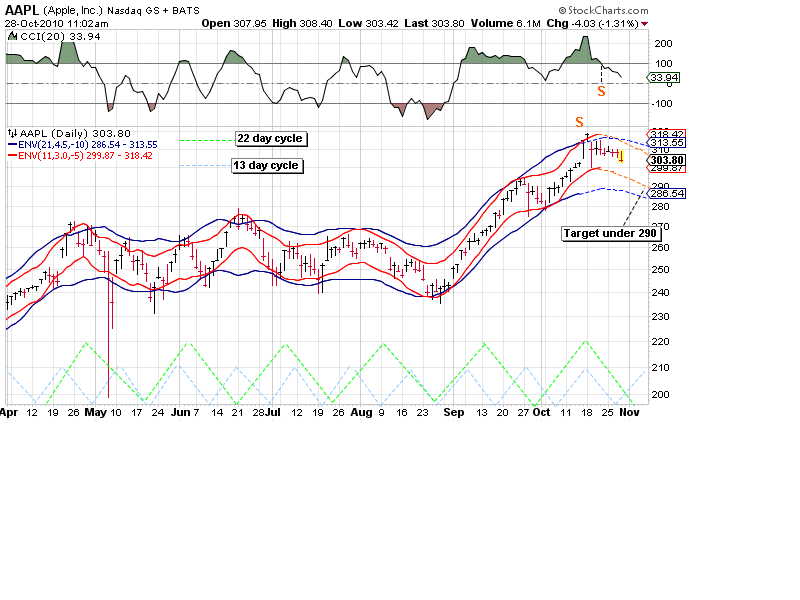
Is APPL ready to top?
APPL has said they expect margins to shrink. That can negatively affect the stock. So how does APPL look from a cycle perspective. It has been trending up since the Mar 09 bottom. That is almost 20 months ago, so we could have a 3.39 year top Nov 19 (20.34 months)?
Here is the shorter term outlook:

Here is the shorter term outlook:
Wednesday, October 27, 2010
Cycle Amzn
Furnished by request. Here is a longer term outlook..... The longer 270 day (Gann cycle length) should top around Nov 19 and appears to be dominant. The short 90 day cycle (Gann cycle length) should bottom around the end of the second week of Nov. This may lead to sideways action in AMZN as it goes through a topping process.


The short cycles are 34 days (Gann cycle length) and an 18 day cycle (Hurst cycle length). 18 day cycle is down and 34 day cycle is up into around Nov 18. Again suggesting sideways movement for the next 7 or so days. Chart suggests a target of around 155 by late Nov.


Tuesday, October 26, 2010
Cycle Update Oct 26 after close
I have looked at the SPY as a proxy for the market. First I looked at the longer cycles. The 3.39 year cycle is over 3 weeks to its top (Nov 19) so it continues to push higher. The next longest cycle that I observed is a 17 week cycle. It is also up. At this time these seem to be the dominant/controlling cycles. So expect the market to grind higher for the next 3.5 weeks.....

Then I looked at the next longest cyce which I believe to be the 34 day cycle. This cycle is down. But I do not believe it has enough force (or downward amplitude) to overcome the longer cycles to any major extent. Sure it will temper any rise (grind higher?) by the longer cycles....
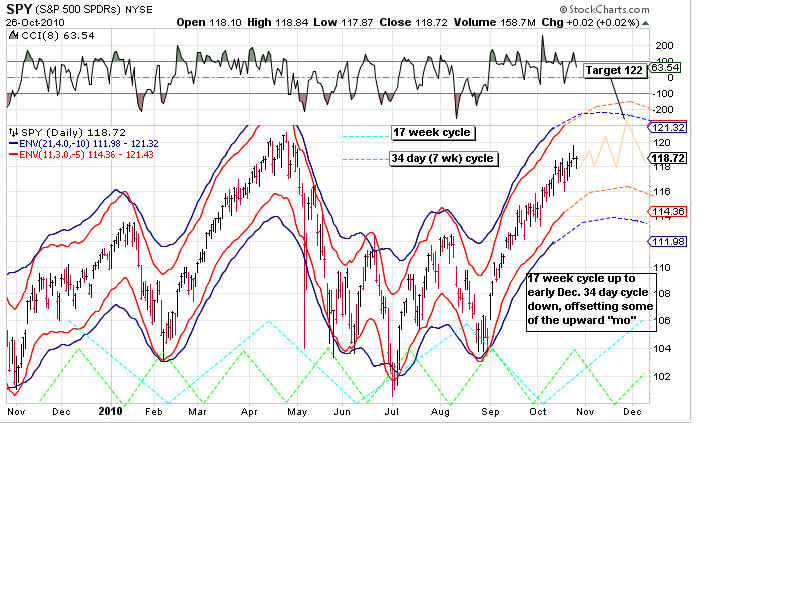
Finally I looked at the next shorter cycle which I believe to be 22 days. Any trading ops (see chart) long will be to buy drops and sell pops. But I believe these opportunities will offer limited profits. I would avoid shorting against the major trend (up).......
GL

Monday, October 25, 2010
Cycle lengths (Gann vs Hurst)
I showed you (INTC post) how to use the vertical line tool to try and zero in on cycles.... But what if you had an idea of what lengths were likely? That would be helpful in your efforts to isolate cycles - wouldn't it?
Well you are in luck. Much research has gone into this subject.
Gann Cycle lengths:
Gann used degress in a circle to compute cycle lengths. The 360% in a circle is approximately the same as 365 days in a year. So he used 180 (half a circle), 90 (quarter of a circle), 45 (1/8 of a circle), 135 (90+35), etc.
He also used eights of 90 for shorter cycles to calculate the trading days in a cycle. 1/8 of 90 is 11.25 days, 2/8 is 22.50 days, 3/8 is 33.75 and 4/8 is 45 days. 5/8 is 56.25, 3/4 is 67.50, 7/8 is 78.75 and 8/8 is 90. If we round these we have cycle in trading days of 11, 22, 34, 45. 67, 79, 90.
Hurst cycle lengths:
2.5 weeks - 18 days - 13-14 TDs (Trading Days) (Gann 11 TDs)
4.6 weeks - 32 days - 23-24 TDs (about 1 month) (Gann 22 TDs)
10 weeks - 70 days - 48-50 TDs (Gann 45 TDs)
1 Qtr - 13 weeks - 91 days - 65 to 67 TDs (13.9 wks?) (Gann 67 TDs)
20 weeks - 140 days - 98-100 TDs (Gann 90 TDs?)
Half yr - 26 weeks - 182 days - 125-128 TDs (Gann 135 TDs?)
3 Qtr - 9 mths - 39 weeks - 273 days - 190-192 TDs (Gann 180 TDs?)
Now there are many more cycles. I have focused on shorter ones that could be used in swing trading. I have covered 2 longer cycles previously. One was the 40.68 month cycle (3.39 years) from Dewy. The other was the PI cycle from Armstrong (1000 x PI or 3,142 days or 8.6 years).
My experience is that the cycles tend to conform better to the Gann cycle lengths than the Hurst cycle lengths. But, many swear by the Hurst interpretation of cycles. I have given you both so you can decide for yourself. With this knowledge you are well on your way to doing your own cycle analysis.
Sunday, October 24, 2010
Regional Bank Index
Since the late April high the regional banks has been one of the weakest groups. Many regional banks are down 25-35% from those highs. So what does cycle analysis say about the regional banks now? I looked at the $KRB regional bank Index and they may be in an uptrend. Time will tell.


Week of Oct 25 from Chartsedge
http://www.chartsedge.com/index.html
I do not suggest you trade based on this projection. I have found sometimes the projections are fairly accurate, sometimes not. Here is their projections for the coming week:

I do not suggest you trade based on this projection. I have found sometimes the projections are fairly accurate, sometimes not. Here is their projections for the coming week:

October 25 is a Bradley date
While lost wandering the forest called the internet I came upon information about Donald Bradley and his method of stock analysis.
Bradley Siderograph - developed in the 1940's by Donald Bradley to forecast the stock markets. Bradley assigned numerical values to certain planetary constellations for every day, and the sum is the siderograph. The siderograph can not reliably predict the direction but only turning points within a time window of +/- 4 calendar days. Inversions (i.e. a high instead of a low and vice versa) are quite common.
 Others have added "pivot points" and "dominant market cycle " to the Bradley projections.
Pivot Points - despite what many people believe, stock market movements are not a random walk. The market does move in cycles. The basis for Elliot Wave Theory is market cycles. Trendlines, one of the oldest forms of chart analysis, are formed across peaks and valleys called pivot points, relative highs and lows on a chart. SMT's proprietary Pivot Point algorithm attempts to forecast the next short-term reversal point.
Dominant Market Cycle - In his book "The Profit Magic of Stock Transaction Timing", J.M. Hurst claims proof that stocks fall in defined cycles. Cycle lengths are calculated from top to top and from top to bottom. The DMC is useful in predicting the next trend change date. Trend changes may also occur around half cycle dates.

I see Bradly Siderograph is looking for a market change around 11/15-16 (+/- 4 days) which corresponds to the likely top of the 40.68 month cycle on 11/19. I make no claim as to the accuracy of these predictions, but found them interesting and am sharing them with you.
Bradley Siderograph - developed in the 1940's by Donald Bradley to forecast the stock markets. Bradley assigned numerical values to certain planetary constellations for every day, and the sum is the siderograph. The siderograph can not reliably predict the direction but only turning points within a time window of +/- 4 calendar days. Inversions (i.e. a high instead of a low and vice versa) are quite common.

Pivot Points - despite what many people believe, stock market movements are not a random walk. The market does move in cycles. The basis for Elliot Wave Theory is market cycles. Trendlines, one of the oldest forms of chart analysis, are formed across peaks and valleys called pivot points, relative highs and lows on a chart. SMT's proprietary Pivot Point algorithm attempts to forecast the next short-term reversal point.
Dominant Market Cycle - In his book "The Profit Magic of Stock Transaction Timing", J.M. Hurst claims proof that stocks fall in defined cycles. Cycle lengths are calculated from top to top and from top to bottom. The DMC is useful in predicting the next trend change date. Trend changes may also occur around half cycle dates.

I see Bradly Siderograph is looking for a market change around 11/15-16 (+/- 4 days) which corresponds to the likely top of the 40.68 month cycle on 11/19. I make no claim as to the accuracy of these predictions, but found them interesting and am sharing them with you.
Saturday, October 23, 2010
Is/has the VIX signaled a top near?
Always keep more than one tool in your toolbox. One thing I watch for a trend change signal is the VIX. There are several variations on how to interpret a trend change. Most look for a 2 standard deviations variance (ie Bollinger Bands) and a confirmation. Put simply that is 47.5% down from a top or 95% up from a bottom. A bottom (2 std dev down) may signal a trend change from "bull" to "bear". A top (2 std dev up) may signal a trend change from "bear" to "bull". That is the general idea - as I said there are differences on what constitutes a confirmation. As I interpret it we are waiting on a confirmation (The VIX has been down recently from its top around 38.60 by 2 standard deviations).

Hope you found this interpretation of the VIX signal interesting as I did.
A unique approach I ran across uses a ratio of the VIX and VXV. It has issued 6 "top" signals since the VXV came about in late 2007 (not counting the signal just given). Of these signals 5 mark tops.

Hope you found this interpretation of the VIX signal interesting as I did.
Friday, October 22, 2010
2011 cyclic environment (PI cycle)
Martin Armstrong documented the PI cycle which is 3.142 x 1000 (3,142) days or 8.61 years. That cycle should have topped at 2007 highs. If so, 4.30 years later is early 2012 when this cycle should bottom. Also the 3.39 year cycle (40.68 months) which I previously discussed will be down for about 20.34 months from Nov 19, 2010 or all of 2011. So we have 2 longer well documented cycles down through all of 2011. I expect a bearish tilt after Nov 2010 and throughout 2011.
Here is the PI cycle:
 And here is info from the Web:
http://www.marketoracle.co.uk/index.php?name=News&file=article&sid=14526 )

Here is the PI cycle:

http://www.marketoracle.co.uk/index.php?name=News&file=article&sid=14526 )
Stock Market Fun, Pi, Phi and Armstrong Cycle
Stock-Markets / Cycles Analysis Oct 26, 2009 - 01:58 PM
By: Forkoholic_Serge
Fun with market dates! I was reading Marty Armstrong today and decided to play with his 8.6 year cycle—3141 days to be exact.
Lets start our count from October 11th 2007 top.
Quick spreadsheet reveals interesting dates: 3141/6.1 where 6.1 is derivative of 0.618 gets us March 09,2009 low! Wow! Playing with 4.2 & 4.23 gets us 10/22 and 10/27 dates—a top perhaps? T-Theory top as well?
Dividing 3141 by 3 gets us August 23, 2010 which is very close to T-Theory’s August 26th top prediction and than there’s a 5/17/2016—a top? a bottom? We shall see :) Just having fun with numbers!
Enjoy & good trading to you!
- Forkoholic Serge -
Here is the spreadsheet (note 1,570 days is half the PI cycle or a bottom Jan 28,2012):

BUCY analysis
I hope this helps the person who requested it. I assume you have done your own research (fundamentals) and may have done some TA. You should not buy/sell based on my analysis (opinion) alone. If you have questions you may have to become a "follower" to post comments and ask questions. I would be most interested in your outlook for BUCY.

My analysis shows 2 shorter cycles should bottom in about 5 days, and should be ripe for a swing trade. Here is the chart:

BTW - I will try and respond to requests as long as they do not become excessive( more than 2-3 a week).
Discovering cycles in a stock - INTC
How does one identify cycles in a stock? Well we could always eyeball it. Problem with that is we may see what we expect to see. So using INTC I will show you a more mechanical way to try and ID cycles. When I first looked at the INTC chart I could make no sense of it (I use Stockcharts.com). So I went to annotate and used the vertical line tool to draw some equidistant lines to try and highlight cycles. I will discuss other techniques for IDing cycles later. Here is what I came up with.....


Thursday, October 21, 2010
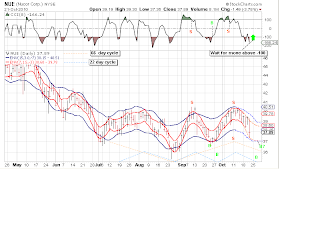
Analyzing an individual stock - NUE
Individual stocks often have cycles that differ from a composite ETF like SPY. So there are always opportunities to go long (or short) regardless of what the overall market is doing. Here is one such stock that may be a buy sometime next week.

Wednesday, October 20, 2010
Oct 20,2010 - swing cycles
I will focus primarily on shorter cycles suitable for swing trades. From time to time I will discuss longer cycles that will allow you to adjust you swing trades to the environment. This environment will affect to a degree how the shorter cycles react. For example the longer trend may be up if you have a longer cycles is pushing toward a top (smaller drops). Or, the longer trend may be down if longer cycle is falling into a bottom (smaller pops).
I will add 2 charts that show these shorter cycles (with annotations and comments).


Added Oct 21:
How do we use cycles to swing trade in a major uptrend?
 I have included a chart of the SPY to illustrate. You decide if this sytem looks useful in your swing trading.
I will add 2 charts that show these shorter cycles (with annotations and comments).


Added Oct 21:
How do we use cycles to swing trade in a major uptrend?
- First we will use the CCI. The Commodity Channel Index (CCI) was designed to identify cyclical turns in commodities. The assumption behind the indicator is that commodities (or stocks or bonds) move in cycles, with highs and lows coming at periodic intervals. For short term swing trades in an uptrending market when the CCI is above 100 and drops below 100 we consider that a sell signal.
- Second we will also use envelope channels to try enclose data within the channel (best fit). We use a bigger channel to enclose the narrower channel. In an uptrending market if the upper inner channel line touches the outer upper channel line we consider that a sell signal. We will buy dips down to the inner channel lower line (uptrending market).
- Third we will try and identify shorter cycles so we can (hopefully) anticipate dips to buy and peaks to sell. I am including a chart of the SPY to illustrate. You decide if this sytem looks useful in your swing trading.
Most common cycle in US stocks top in November
The 3.39 year (40.68 month) cycle is also the dominant cycle in the US stock market and commonly called the 40 month cycle and is, according to Edward Dewey, a famous cyclic analyst, the most commonly reported cycle of all.


Subscribe to:
Posts (Atom)