I said last week - "Two shorter cycles bottoming during the week". From the current chart appears those 2 shorter cycles are definitely up. Not sure the "M" pattern will develop....
WARNING: One thing that always screws with the timing of tops and bottoms during this time (Nov through mid January) is the multiple days the market is closed due to holidays (Thanksgiving - 1.5 days, Christmas - 1 day, New Years - 1 day and MLK day. A total of 4.5 days market is closed in about 1.5 months). So be aware of the potential compression of market days in a cycle during this time of year.
Appears though the market should have an upward bias in the coming week.
GL traders
Update - gold/silver index:
Hitting resistance as 7 week cycle tops (should bottom 3rd week of February as 3.5 month cycle tops).
Cycles are a tool and should not be used to the exclusion of other tools. There is always the possibility (high probability long term) that the data will be misinterpreted or a relevant fact over looked. So use cycles to check your analysis, not as the only reason to make a decision. Interpretation is the opinion of the author and may be incorrect and should be viewed in that light.
Saturday, January 21, 2017
Sunday, January 15, 2017
Jan 16, 2017 weekly outlook
Two shorter cycles bottoming during the week (an "M" formation?). Nothing is for certain and patterns are rarely perfect, but if the pattern develops as expected the coming week should fall as the pattern develops.
Bottoms may not match actual data and require some adjustments....
GL traders
Update Jan 18 (see comment on Hurst signal):
Bottoms may not match actual data and require some adjustments....
GL traders
Update Jan 18 (see comment on Hurst signal):
Saturday, January 7, 2017
Jan 9, 2017 weekly outlook
Looking at last week, you should have bought Tuesday. The market is whipsawing traders (and I missed that call). Chartists call the recent activity a mid-cycle move down. This usually gives us an "M" formation and it appears we have the first 3/4 of that formation.
If that formation completes then the market will be down in the coming week. I believe we have better than a 50% chance the week is down.
GL traders
Update:
Update Jan 12:
update Jan 13:
If that formation completes then the market will be down in the coming week. I believe we have better than a 50% chance the week is down.
GL traders
Update:
Update Jan 12:
update Jan 13:
Friday, December 30, 2016
Weekly outlook for Jan 2, 2017
I said last week:
It appears the 10 week cycle did top and turned down. That down pressure from the 10 week cycle should continue into the new year.
Can't do much better than that...
The 10 week cycle continues down. The 5 week cycle is also down. These two cycles should bottom by Monday Jan 9 and then turn up...
GL traders - hope you had a prosperous 2016.
Update Jan 03, 2017: $gold
It appears the 10 week cycle did top and turned down. That down pressure from the 10 week cycle should continue into the new year.
Can't do much better than that...
The 10 week cycle continues down. The 5 week cycle is also down. These two cycles should bottom by Monday Jan 9 and then turn up...
GL traders - hope you had a prosperous 2016.
Update Jan 03, 2017: $gold
Sunday, December 25, 2016
Week of Dec 26, 2015 outlook
I said last week: "10 week cycle near top and should turn down in coming week. I expect some weakness into Christmas". Still under 20k on the Dow as we got some down days in the week. So my expectations were fulfilled.
It appears the 10 week cycle did top and turned down. That down pressure from the 10 week cycle should continue into the new year. Some may be holding off taking profits until January since Trump has promised reduced taxes. We'll see soon.
Have a pleasant week and happy New Year.
Dec 29 - UPDATE
FLD (line) touched from above, Potential sell off...
It appears the 10 week cycle did top and turned down. That down pressure from the 10 week cycle should continue into the new year. Some may be holding off taking profits until January since Trump has promised reduced taxes. We'll see soon.
Have a pleasant week and happy New Year.
Dec 29 - UPDATE
FLD (line) touched from above, Potential sell off...
Sunday, December 18, 2016
Dec 19, 2016 weekly outlook
Less upside than I thought probable (DOW fell just short of 20K). 10 week cycle near top and should turn down in coming week. I expect some weakness into Christmas.
Last week TSI showed a buy (green arrow), that has now reversed to a sell (red arrow).
Merry Christmas traders
Last week TSI showed a buy (green arrow), that has now reversed to a sell (red arrow).
Merry Christmas traders
Saturday, December 17, 2016
Sunday, December 11, 2016
Dec 13, 2016 weekly outlook
Seems my charts may be off (early bottom by 2+ days). Should know by end of next week.
Cycles should be up for the coming week.
Gl traders
Cycles should be up for the coming week.
Gl traders
2017 outlook
First the Bradley Siderograph:
1. standard window = week *after* the Bradley date: Most index turns (about P=80%) come late, i.e. in the week after the Bradley date. This is part of the end times phenomenon where ‘everything is delayed’, consistently observed since 2013. Reason: the battle of the powers of light & darkness (Armageddon), which are in a kind of deadlock. So the (new)standard window is the week *after* the Bradley date, the extended window is +/- 1 week.
2. polarity reversals: Most of the big Bradley turns (some P=80%) produce the *opposite* polarity in the indices, i.e. an important Bradley high usually becomes a stock index low.
Then cycle circle chart for 2017:
Happy New Year
1. standard window = week *after* the Bradley date: Most index turns (about P=80%) come late, i.e. in the week after the Bradley date. This is part of the end times phenomenon where ‘everything is delayed’, consistently observed since 2013. Reason: the battle of the powers of light & darkness (Armageddon), which are in a kind of deadlock. So the (new)standard window is the week *after* the Bradley date, the extended window is +/- 1 week.
2. polarity reversals: Most of the big Bradley turns (some P=80%) produce the *opposite* polarity in the indices, i.e. an important Bradley high usually becomes a stock index low.
Then cycle circle chart for 2017:
Happy New Year
Friday, December 2, 2016
Dec 5, 2016 weekly outlook
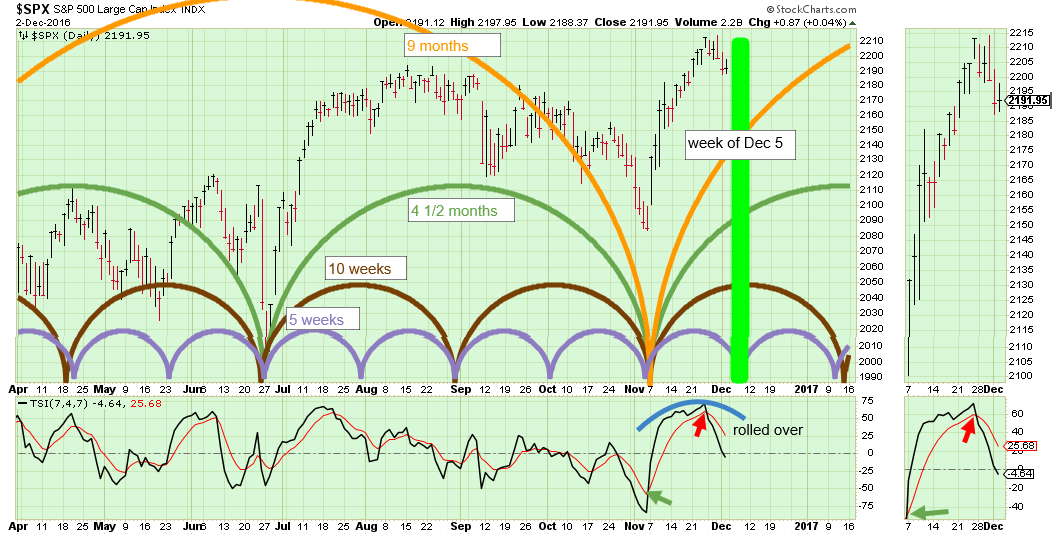
I said last week "I expect a sideways market, odds may slightly favor a down week.". What happened? DOW Industrials up about .1% (slight gain), SnP500 down about 1%, small cap R2K down about 2%. Overall sideways with a down bias. I think my call was close to market action.
This week the 5 week cycle should bottom by around mid week and turn up, So for the week the market moves sideways with highs at the beginning or end of the week and lows mid week. Remember the other cycles are up so odds are the high will be end of the week, but the trend for the week is primarily sideways.
GL traders
This week the 5 week cycle should bottom by around mid week and turn up, So for the week the market moves sideways with highs at the beginning or end of the week and lows mid week. Remember the other cycles are up so odds are the high will be end of the week, but the trend for the week is primarily sideways.
GL traders
Subscribe to:
Posts (Atom)