
Thursday, June 30, 2011
Cycles and QE2
We do not know the impact of the end of QE2, We do know the impact though QE2 Japan ending had. I have copied a chart from http://www.safehaven.com/article/21532/qe2-ends-long-live-the-free-market-ha
![]() We see that the ending of QE2 in Japan was followed by a downside market. I know of no other real example.....
We see that the ending of QE2 in Japan was followed by a downside market. I know of no other real example.....

Comments and outlook 07-01-2011
I told you last night I could not understand or explain based on my cycle analysis the levels of the market. Now I could have thrown out a lot of BS explanations like this:
1). Tomorrow is the solar eclipse following the lunar eclipse on June 15. Basically the stock market headed down with the first solar eclipse on June 1st and bottomed on the lunar eclipse on June 15th and now is rallying into the latest solar eclipse. Puetz crash theory stipulates that a lunar eclipse following a solar eclipse generally initiates a hard down phase (it doesn't always happen).
2). July 1st is a new moon and a full moon is on July 15th. The market usually tops on a full or new moon. Note: at this time the moon cycle and 22TD cycle are much the same.
3) Spiral date calendar was high Jun 27-30: http://spiraldates.com/2011/charts/scores_0611.png
This is just a sample of what I could have said, and even though I sometimes point out these things they are not a critical part of my cycle analysis. But I could have offered these and more excuses for index levels I could not explain using cycles. I am not telling you not to look at these things (I do).
OK, what does tomorrow offer? Today should have been the top of the 22TD cycle. It will take 2-3 days for the 22TD cycle to gain downside momentum. If you look at the SPY chart I will present you will see this is because some of the shorter cycles are pushing up at this time.
So the 22TD cycle is down. The 11.2TD cycle is up, the 5.6TD cycle is up, the 2.8TD is up part of the day and tops by afternoon. So I doubt we can expect any or little downside from this alignment of shorter cycles.
In theory though we have had pressure accumulating from the longer cycles that could begin to take control and move the market down.
Here is the SPY chart:
![]() GL traders. I have accumulated the 2X inverse ETF of the Qs. In addition I have sold August out-of-the calls on 2 long positions to provide some downside insurance and still let me profit some if I am wrong and the market advances. Even in down markets I will hold some long positions on stocks that have good chart patterns. Be careful.
GL traders. I have accumulated the 2X inverse ETF of the Qs. In addition I have sold August out-of-the calls on 2 long positions to provide some downside insurance and still let me profit some if I am wrong and the market advances. Even in down markets I will hold some long positions on stocks that have good chart patterns. Be careful.
1). Tomorrow is the solar eclipse following the lunar eclipse on June 15. Basically the stock market headed down with the first solar eclipse on June 1st and bottomed on the lunar eclipse on June 15th and now is rallying into the latest solar eclipse. Puetz crash theory stipulates that a lunar eclipse following a solar eclipse generally initiates a hard down phase (it doesn't always happen).
2). July 1st is a new moon and a full moon is on July 15th. The market usually tops on a full or new moon. Note: at this time the moon cycle and 22TD cycle are much the same.
3) Spiral date calendar was high Jun 27-30: http://spiraldates.com/2011/charts/scores_0611.png

This is just a sample of what I could have said, and even though I sometimes point out these things they are not a critical part of my cycle analysis. But I could have offered these and more excuses for index levels I could not explain using cycles. I am not telling you not to look at these things (I do).
OK, what does tomorrow offer? Today should have been the top of the 22TD cycle. It will take 2-3 days for the 22TD cycle to gain downside momentum. If you look at the SPY chart I will present you will see this is because some of the shorter cycles are pushing up at this time.
So the 22TD cycle is down. The 11.2TD cycle is up, the 5.6TD cycle is up, the 2.8TD is up part of the day and tops by afternoon. So I doubt we can expect any or little downside from this alignment of shorter cycles.
In theory though we have had pressure accumulating from the longer cycles that could begin to take control and move the market down.
Here is the SPY chart:

Wednesday, June 29, 2011
Outlook for 06-30-2011
Tomorrow morning should mark the top of the 22TD cycle.
I can't explain the level of the market. Every analysis I run indicates it should be at least 10 points (and probably more) lower using the most optimistic assumptions. Greeks rioting is evidently good for the market. I suppose if the Greeks had burned down a building it would be even higher.
Here is the SPY:
![]() GL traders. Interesting similarity between 06/21 and today.
GL traders. Interesting similarity between 06/21 and today.
I can't explain the level of the market. Every analysis I run indicates it should be at least 10 points (and probably more) lower using the most optimistic assumptions. Greeks rioting is evidently good for the market. I suppose if the Greeks had burned down a building it would be even higher.
Here is the SPY:

Tuesday, June 28, 2011
Comments and outlook for 06-29-2011
Strike two!! OK, not a swing and a miss - more like a foul ball. I talked about the 22TD cycle last evening and how it was hard up, but thought maybe it would lose some of its upward "mo". It didn't.
So let's try again. Tomorrow the 22TD cycle should top by EOD or early the following day and as it is topping it should lose its ramp up momentum. We have the 22TD cycle up and topping toward the end of the day tomorrow. We have the 11.2TD, 5.6TD, and 2.8TD cycles down and bottoming toward the end of the day (or early the next day). This should limit the upside for the 22TD cycle. There are a cluster of tops 1298-1299 so I am expecting this may provide upside resistance and limit any upside tomorrow. We may see 1300, but I doubt we approach the next FIB at 1310.30. WARNING: I could be off by 2-4 hours in regards to the top.
In addition to the 3 shorter cycles being down we have the 20 week (Wall) cycle down and the 1 year cycle ready to bottom in early July. Given this setup I do not see how there is a lot of upside left before we reverse to the down side as soon we will have the 22TD, and the 20week cycles down and the 1 year cycle bottoming... So tomorrow I expect very moderate upside, but possibly red by EOD.
Here is the SPY visual:
![]() GL traders. Do your own analysis.
GL traders. Do your own analysis.
So let's try again. Tomorrow the 22TD cycle should top by EOD or early the following day and as it is topping it should lose its ramp up momentum. We have the 22TD cycle up and topping toward the end of the day tomorrow. We have the 11.2TD, 5.6TD, and 2.8TD cycles down and bottoming toward the end of the day (or early the next day). This should limit the upside for the 22TD cycle. There are a cluster of tops 1298-1299 so I am expecting this may provide upside resistance and limit any upside tomorrow. We may see 1300, but I doubt we approach the next FIB at 1310.30. WARNING: I could be off by 2-4 hours in regards to the top.
In addition to the 3 shorter cycles being down we have the 20 week (Wall) cycle down and the 1 year cycle ready to bottom in early July. Given this setup I do not see how there is a lot of upside left before we reverse to the down side as soon we will have the 22TD, and the 20week cycles down and the 1 year cycle bottoming... So tomorrow I expect very moderate upside, but possibly red by EOD.
Here is the SPY visual:

Monday, June 27, 2011
comments and outlook for 06-28-2011
Update - noon - the 22TD cycle contines to ramp up. One more day (tomorrow) to the top.
My call for today was totally wrong!!! Of course, if you do this you will be wrong some of the time. Question I am asking myself is if I need to adjust/reposition my placement of the cycles. But, I need more time/data to make that decision.
One thing you will learn if you trade is - you may expect something and the opposite happens. When that happens you have decide how to play it. You always play the market in front of you - not what you thought would happen. So with the market up substantially (and the NAZ up the most) I took a partial position in QID (double inverse ETF of the NAZ 100) because I believe the downside is not complete. If I am wrong I lose.
Tomorrow it looks like the 11.2TD and 5.6TD cycles should be down. The 22TD cycle is hard up into a top. The 2.8TD is up. With the 22TD hard up into a top there may be an upward bias to the short cycles (that appeared to be the case today). So the longer cycles (20 week and 1 year) may decide the outcome tomorrow. The 22TD cycle spent quite a bit of its upside amplitude today. So I expect tomorrow will be down. I could be wrong (again) if I am wrong about the strength of the 22TD cycle's up momentum.
Here is a chart of the SPY:
![]() GL traders. Be careful and remember - you always have to trade the market in front of you not some opinion on a blog.
GL traders. Be careful and remember - you always have to trade the market in front of you not some opinion on a blog.
My call for today was totally wrong!!! Of course, if you do this you will be wrong some of the time. Question I am asking myself is if I need to adjust/reposition my placement of the cycles. But, I need more time/data to make that decision.
One thing you will learn if you trade is - you may expect something and the opposite happens. When that happens you have decide how to play it. You always play the market in front of you - not what you thought would happen. So with the market up substantially (and the NAZ up the most) I took a partial position in QID (double inverse ETF of the NAZ 100) because I believe the downside is not complete. If I am wrong I lose.
Tomorrow it looks like the 11.2TD and 5.6TD cycles should be down. The 22TD cycle is hard up into a top. The 2.8TD is up. With the 22TD hard up into a top there may be an upward bias to the short cycles (that appeared to be the case today). So the longer cycles (20 week and 1 year) may decide the outcome tomorrow. The 22TD cycle spent quite a bit of its upside amplitude today. So I expect tomorrow will be down. I could be wrong (again) if I am wrong about the strength of the 22TD cycle's up momentum.
Here is a chart of the SPY:

Sunday, June 26, 2011
July 2011 spiral dates
Information to supplement cycle analysis: http://spiraldates.com/2011/charts/scores_0711.png

Comments and outlook for 06-27-2011
Update - 11:40 - well this is not how I thought the market wild behave today (so far).
Last week turned out to be more bearish than I anticipated as it seems the longer cycles took firm control by the last two days of the week. Of interest is Jun 22 was a Bradley Turn date: http://swingcycles.blogspot.com/2010/12/12-15-bradley-turn-dates-2011.html
The next turn day of interest appears to be late July.
So now it appears the 20week cycle down side momentum is picking up and the 1 year cycle is pushing hard to a bottom July 1 or July 5. I expect these 2 longer cycles to dominate Monday.
The 22 TD cycle continues up for about 3 days into Wednesday. The 11.2TD cycle is down. The 5.6 day cycle is up, but should top by 2:30-3:00 in the afternoon. The 2.8TD cycle is down and should bottom about the time the 5.6TD cycle tops. So it appears that the shorter cycle has a neutral to slightly down bias (leaving the control to the longer cycles).
I expect on Monday we will break below the 200 Day MA and probably the 1259.55 FIB and possibly test the Mar low of around 1250.
Here is the visual of the SPY:
![]() GL traders. Do your own analysis. Beware the bear.
GL traders. Do your own analysis. Beware the bear.
Last week turned out to be more bearish than I anticipated as it seems the longer cycles took firm control by the last two days of the week. Of interest is Jun 22 was a Bradley Turn date: http://swingcycles.blogspot.com/2010/12/12-15-bradley-turn-dates-2011.html
The next turn day of interest appears to be late July.
So now it appears the 20week cycle down side momentum is picking up and the 1 year cycle is pushing hard to a bottom July 1 or July 5. I expect these 2 longer cycles to dominate Monday.
The 22 TD cycle continues up for about 3 days into Wednesday. The 11.2TD cycle is down. The 5.6 day cycle is up, but should top by 2:30-3:00 in the afternoon. The 2.8TD cycle is down and should bottom about the time the 5.6TD cycle tops. So it appears that the shorter cycle has a neutral to slightly down bias (leaving the control to the longer cycles).
I expect on Monday we will break below the 200 Day MA and probably the 1259.55 FIB and possibly test the Mar low of around 1250.
Here is the visual of the SPY:

comments on gold - 06-26-2011
I do not follow gold the way some seem to do. If you think about it gold is a very small portion of the real assets in the world when compared to things like oil, coal, natural gas, copper, land, etc. Still it gets more written about it than almost any asset. Personally I think one may be better off investing in raw land. At least then you have an asset that can produce the food you eat. You can't eat gold, there is little demand for it as a component of manufacturing. Other than burying it in the back yard in a chest or making jewelry it has few uses. Yet, many consider it the ultimate store of value and historical it has been an exchange medium.
Depending on who you read gold id going to $2,500 or more or going to $1,000. It may do both? If you look at the low in the past 32 years it is about 600% above that low. But if you look at the high the past 32 years and inflation adjust that high it would have to be over $2,000 to match that high. Pick your point of reference and make your argument....
As swing traders though we are more interested in what gold will do in the next few weeks. Many seem to think we get a pullback in the near term and I have seen the number of $1300 mentioned (that would be about a 16% correction from its pear around $1550). I have also seen the number $1650 mentioned more than once or about a 6% advance from its peak.
I took a look and it seems to me we will get a bit more of a correction (at $1500 we are about 3% off the peak), but $1300 seems a bit low. After that we may see an indeterminate advance. I looked at the weekly $GOLD chart and we had a 1 year cycle bottom earlier at around $1500 and have been going sideways between $1500-1550. The logical question is - why? The answer appears to be that we have a 26 week (1/2 year cycle) moving toward a bottom in late July as the 1 year cycle which bottomed around the 1st week of May moves up. Essential these 2 cycles are competing for control of $GOLD causing the sideways movement.
So how does it work out? Looking at DPO to try and determine the amplitude of these two cycles and how it plays out it appears the gold will pull back about another 3% (total 6-7%) to around $1450 by the 3rd or 4th week of July. So while I agree that gold should pull back it seems to me it will be less than many anticipate (at least in the near term).
Here is the $GOLD chart:
![]() Gl traders. Do your own analysis, As always be careful - I could be wrong.
Gl traders. Do your own analysis, As always be careful - I could be wrong.
Depending on who you read gold id going to $2,500 or more or going to $1,000. It may do both? If you look at the low in the past 32 years it is about 600% above that low. But if you look at the high the past 32 years and inflation adjust that high it would have to be over $2,000 to match that high. Pick your point of reference and make your argument....
As swing traders though we are more interested in what gold will do in the next few weeks. Many seem to think we get a pullback in the near term and I have seen the number of $1300 mentioned (that would be about a 16% correction from its pear around $1550). I have also seen the number $1650 mentioned more than once or about a 6% advance from its peak.
I took a look and it seems to me we will get a bit more of a correction (at $1500 we are about 3% off the peak), but $1300 seems a bit low. After that we may see an indeterminate advance. I looked at the weekly $GOLD chart and we had a 1 year cycle bottom earlier at around $1500 and have been going sideways between $1500-1550. The logical question is - why? The answer appears to be that we have a 26 week (1/2 year cycle) moving toward a bottom in late July as the 1 year cycle which bottomed around the 1st week of May moves up. Essential these 2 cycles are competing for control of $GOLD causing the sideways movement.
So how does it work out? Looking at DPO to try and determine the amplitude of these two cycles and how it plays out it appears the gold will pull back about another 3% (total 6-7%) to around $1450 by the 3rd or 4th week of July. So while I agree that gold should pull back it seems to me it will be less than many anticipate (at least in the near term).
Here is the $GOLD chart:

Friday, June 24, 2011
Comment and outlook for week of 06-27-2011
Last week I misjudged the downside potential of the longer cycles at the end of the week and we ended the considerably lower than I had projected. Hopefully I corrected that this week (but not over corrected).
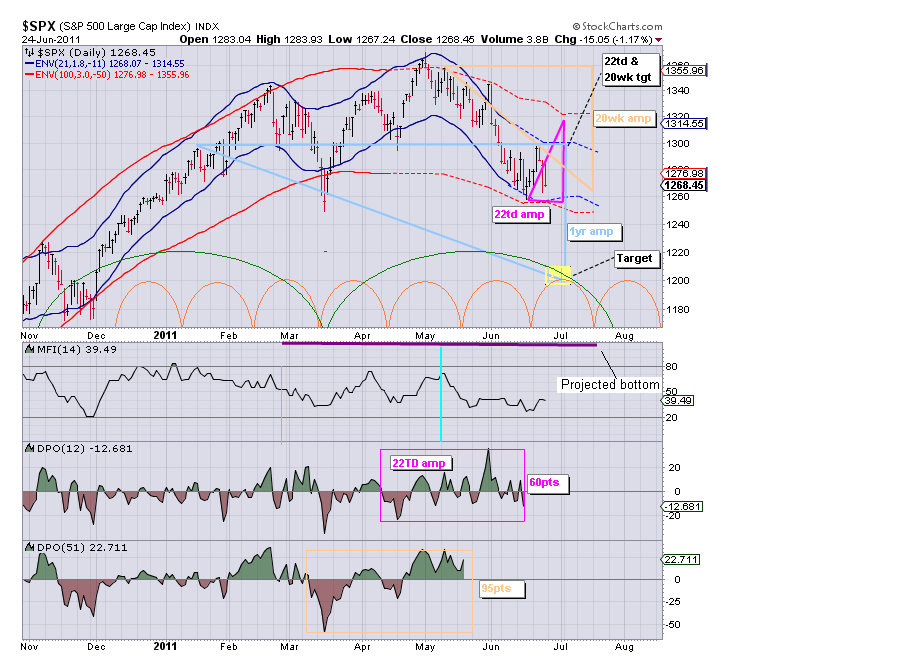
The 20 week cycle is starting to show more downside momentum in my opinion. The 1 year cycle should make a final and very strong thrust as it should bottom around the 1st of July. The fly in the soup is the 22TD cycle should also be topping around the end of the week about the same time the 1 year cycle bottoms. The 22TD cycle has considerable amplitude (around 60 S&P points or 25 points for 5 days). In isolation that would push the S&P to around 1295, but it is not in isolation. The 20 week cycle is down and should subtract 20 or more points giving us a target of 1275 on the S&P for these two cycles.
In addition to this we have the 1 year cycle down very hard. I believe this will lead to breaking the 200 day MA around 1263, the FIB at 1259.55 and then the Mar low around 1250 and FIB at 1247.50. It this plays out then the S&P will free fall to the 1228.18 FIB and possibly lower by early July. This could happen as soon as Fri Jul 1, but may be Tue Jul 5 (depending on exactly when the 1 year cycle bottoms). My FIBs targets which I believe will contain the market move are 1196.81 and 1278.94
Now I realize this sounds a bit extreme, but I have to interpret the data as I see it. Here are the FIBS:
![]() Here is a chart of the SPX showing the 22TD, 20 week and 1 year cycle amplitudes overlaid to produce a target:
Here is a chart of the SPX showing the 22TD, 20 week and 1 year cycle amplitudes overlaid to produce a target: ![]() GL. Do you own analysis - my projections are pretty extreme - but the data as I interpret it seems to support those projections.
GL. Do you own analysis - my projections are pretty extreme - but the data as I interpret it seems to support those projections.
The 20 week cycle is starting to show more downside momentum in my opinion. The 1 year cycle should make a final and very strong thrust as it should bottom around the 1st of July. The fly in the soup is the 22TD cycle should also be topping around the end of the week about the same time the 1 year cycle bottoms. The 22TD cycle has considerable amplitude (around 60 S&P points or 25 points for 5 days). In isolation that would push the S&P to around 1295, but it is not in isolation. The 20 week cycle is down and should subtract 20 or more points giving us a target of 1275 on the S&P for these two cycles.
In addition to this we have the 1 year cycle down very hard. I believe this will lead to breaking the 200 day MA around 1263, the FIB at 1259.55 and then the Mar low around 1250 and FIB at 1247.50. It this plays out then the S&P will free fall to the 1228.18 FIB and possibly lower by early July. This could happen as soon as Fri Jul 1, but may be Tue Jul 5 (depending on exactly when the 1 year cycle bottoms). My FIBs targets which I believe will contain the market move are 1196.81 and 1278.94
Now I realize this sounds a bit extreme, but I have to interpret the data as I see it. Here are the FIBS:

Thursday, June 23, 2011
Comments and outlook for 06-24-2011
Update 12:15 The morning was not according to expectations. The longer cycles appear to be dominating. So, we probably close the week on a down market.
I mentioned the possibility that we could see some carry over from Wednesday's close. Then we got poor employment numbers followed by the action of the IEA. These two news items exaggerated the move down. I would guess it added 150-200 points to the down move as they supported the possible continuation of Wednesday's close.
Then during the day the shorter cycles kicked in and moved the market up. By 2:30-3:00 about half of the severe early sell off had been wiped out. Then shortly before 3:00 PM we got news that an agreement between the IMF-EU-Greece had been reached. This supported the short cycles up move and by the close most of the early day sell off had been eliminated.
News can and does affect cycles. In this case we saw the early market (that probably would have been down) down much more than one would reasonably expect. So the news supported the probable market cyclic action and we had a severe sell off. In the afternoon the IMF-EU-Greece news supported the push up by the shorter cycles and almost wiped out the early day sell down. Still it seemed to me we could see the effect of the cycles (especially between these news events as the shorter cycles pushed up). Yes, news can and does affect the cycles (depending on the news it may exaggerate or suppress the cycles). Today was a great example of news exaggerating the cyclic moves.
Tomorrow we have the shortest cycle - the 2.8TD cycle topping by midday. The 5.6TD cycle is up, The 11.2TD cycle is down. The 22TD cycle is up. So it seems in the early session we may have an up bias, but by afternoon it is down bias from the shorter cycles.
The 20week (Wall) cycle provides moderate down pressure. The 1 year cycle is down hard as it pushes toward a bottom in early July. So, in summary we may get a small rally early in the day followed by what could be a somewhat vigorous sell down in the afternoon. If course that assumes the PTBs don't pull more rabbits out of the hat.
Here is a visual using the SPY:
![]() Gl traders. Be careful. My plan is to short (buy inverse ETFs) on any morning strength. You should make your own plan.
Gl traders. Be careful. My plan is to short (buy inverse ETFs) on any morning strength. You should make your own plan.
I mentioned the possibility that we could see some carry over from Wednesday's close. Then we got poor employment numbers followed by the action of the IEA. These two news items exaggerated the move down. I would guess it added 150-200 points to the down move as they supported the possible continuation of Wednesday's close.
Then during the day the shorter cycles kicked in and moved the market up. By 2:30-3:00 about half of the severe early sell off had been wiped out. Then shortly before 3:00 PM we got news that an agreement between the IMF-EU-Greece had been reached. This supported the short cycles up move and by the close most of the early day sell off had been eliminated.
News can and does affect cycles. In this case we saw the early market (that probably would have been down) down much more than one would reasonably expect. So the news supported the probable market cyclic action and we had a severe sell off. In the afternoon the IMF-EU-Greece news supported the push up by the shorter cycles and almost wiped out the early day sell down. Still it seemed to me we could see the effect of the cycles (especially between these news events as the shorter cycles pushed up). Yes, news can and does affect the cycles (depending on the news it may exaggerate or suppress the cycles). Today was a great example of news exaggerating the cyclic moves.
Tomorrow we have the shortest cycle - the 2.8TD cycle topping by midday. The 5.6TD cycle is up, The 11.2TD cycle is down. The 22TD cycle is up. So it seems in the early session we may have an up bias, but by afternoon it is down bias from the shorter cycles.
The 20week (Wall) cycle provides moderate down pressure. The 1 year cycle is down hard as it pushes toward a bottom in early July. So, in summary we may get a small rally early in the day followed by what could be a somewhat vigorous sell down in the afternoon. If course that assumes the PTBs don't pull more rabbits out of the hat.
Here is a visual using the SPY:

Subscribe to:
Posts (Atom)