There are few if any experts thought more highly of than Martin Armstrong. Here are recent thoughts from him:
http://www.safehaven.com/article/24880/martin-armstrong-on-the-sovereign-debt-crisis
GL readers
Thursday, March 29, 2012
03-30-2012 Charles Nenner speaking out
Been a while (several months) since I have seen anything from Nenner. Now there are multiple articles in March. His view seems to be the stock market tops by mid-April and heads down. I cannot argue with that and have talked about the 42 month Kitchen cycle which bottomed in March 2009 and should bottom around mid Sept 2012. With longer cycles you tend to get the most downside in about the last 1/8th of the cycle (1/8 x 42 = 5.25 months. October less 5 months is April, or time to head south).
Nenner also says he got out of gold last year around $1900, but it is now time to buy gold (and silver) with a target of $2500 on gold ($50+ on silver). But instead of me telling you - read for yourself - here are the links:
http://www.businessinsider.com/gold-2500-2012-3
http://www.forbes.com/sites/johnnavin/2012/03/25/an-interview-with-technical-analyst-charles-nenner/?feed=rss_home
http://finance.yahoo.com/blogs/breakout/market-rally-peak-next-month-charles-nenner-150005109.html
Gl traders
Sunday, March 25, 2012
03-25-2012 observations
We said last week we expected the market to flatten and then turn down. I would say that is close to what happened. This week we expect the market to grudgingly give some ground. Since it is end of month and end of quarter we may see some portfolio adjustments. A fund that has seen APPL (IBM) exceed 5 % of the portfolio because of its rise may have to trim back under 5% (if they limit any one position to 5%). So we could see some weakness in high fliers if this happens. Not sure to what extent this could be an issue, but if high fliers give ground then the market as a whole will give ground. Just something to keep in mind.
Longer term is operation "Twist". QE1 and QE2 both boosted equities in the spring of 2010 and 2011. TWIST seems to be doing the same this year as the FED sells short term bonds and buys longer term bonds as it attempts to suppress longer term rates. This has been working, but 10 year rates have started to move up, so maybe the FED is out of ammo. Seems they are running out of short term bonds to sell. I suspect we may see a repeat of a sell off as the FED operation "Twist" comes to an end same as we did at the end of QE1 and QE2. And "Twist" may be coming to an end sooner than expected - which could lead to a market downturn as early as April/May (there is some indication of that in the cycles).
Here is the SPX:
 GL traders, have a profitable week.
Longer term is operation "Twist". QE1 and QE2 both boosted equities in the spring of 2010 and 2011. TWIST seems to be doing the same this year as the FED sells short term bonds and buys longer term bonds as it attempts to suppress longer term rates. This has been working, but 10 year rates have started to move up, so maybe the FED is out of ammo. Seems they are running out of short term bonds to sell. I suspect we may see a repeat of a sell off as the FED operation "Twist" comes to an end same as we did at the end of QE1 and QE2. And "Twist" may be coming to an end sooner than expected - which could lead to a market downturn as early as April/May (there is some indication of that in the cycles).
Here is the SPX:

Wednesday, March 21, 2012
03-21-2012 Charts from Victor
Hi Inlet,
So I have an 80/40/20/10 day cycle chart here and it seems to be in line up to a year back. I guess my question is how valid is this? I noticed that you used to reference it but have switched to a Wall Cycle and it now lines up differently because the periods are different lengths
tx,
v
Note: Victor - I inverted colors on your charts to try and make them a bit more readable.... Here are the charts:

Second chart:

Victor - BTW - nice job on the charts. To try and answer your question - I have no license that says my interpretation will always be correct. Your interpretation may be the correct one. I am just glad you are taking the time and interest to do you own analysis. I try and find the interpretation that bests fits the data. I may or may not find that best fit.
Your 80 day length closely tracks T-Theory (see blogs I follow - Terry Laundry - he uses 16 weeks and 5 x 16 = 80).
Appreciate your input.
Update: For clarity here is Victor's Chart #1 reproduced on StockCharts. Any errors are strictly mine:

Update: For clarity here is Victor's Chart #1 reproduced on StockCharts. Any errors are strictly mine:
Tuesday, March 20, 2012
03-21-2012 observations
Not much of a change from last post. I had speculated a 1410 high (we got 1412+ I believe). I also speculated we would get a flattening out (with today's pullback that may be happening). After that we should see a bit of a pullback (under 1400 - maybe 1375). Not the time for a huge pullback yet - got to get all the sheep rounded up for the shearing first?
Here is an updated picture:
 GL traders
Here is an updated picture:
Friday, March 16, 2012
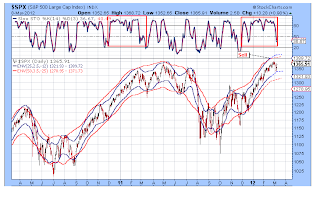
03-16-2012 observations
We broke above 1400 target. Seems though the market is losing upside momentum. The DOW has been up 7 (or is it 8) days in a row and runs like this are rare and overdue a rest. I suspect we could see 1408-1410 as a top.
In looking at the charts is see once we reach this juncture of cycles though the market tends to go flat for 4-5 days. Here is the SPX showing this:
 GL traders
In looking at the charts is see once we reach this juncture of cycles though the market tends to go flat for 4-5 days. Here is the SPX showing this:
Tuesday, March 13, 2012
03-14-2012 outlook
A week ago I told you I believed the Qtr Wall cycle had bottomed and we would see a drift up for about 2 weeks. The move up was much sharper than I thought and reached levels higher than I anticipated in such a short period. It now looks as if we may be reaching a top looking at the 25TD DPO (1400?). Tomorrow should give us a clearer picture. It could go somewhat higher as it is still 3-5 TDs to the time that the qtr Wall should top.
Here is the outlook:
 GL traders. May buy more RWM if it breaks below $26.
Here is the outlook:

Thursday, March 8, 2012
03-09-2012 Slow Sto
According to Robert McHugh if the Slow Sto stays above 20 for 2.5 months a sell off normally occurs (+/- 2 weeks). Here is the Slow STO:
 Bought back RWM I sold on Tuesday. GL traders.

Wednesday, March 7, 2012
03-07-2012 outlook
Looked at some of the stock market blogs. Seems several are talking about a substantial sell off (1200, 1100, 1000, and lower. Now maybe they will be right (eventually), but it appears to me we set a bottom for the quarter Wall cycle (25TDs) yesterday. We now have a substantial gap down that makes a target to be filled as the Quarter Wall cycle turns up. So maybe we get the sell off many are calling for, but it is not going to be straight down. I think we take the next 12 or so TDs repairing the damage from yesterday before we continue down (turn around Mar 19-20).
Here is an updated chart for SPX:
 Given this outlook I cashed in 1/2 my RWM position yesterday for a 2+% profit. I will look to buy more RWM down near $27. GL traders.
Here is an updated chart for SPX:
Monday, March 5, 2012
03-06-2012 Cycles and Elliot Waves
Elliot Waves are a methodology of tracking cycles. I find it tedious with lots of rules and exceptions. But here Elliot Wave in theory as applied to the growth (inventory or Kitchin cycle and its sub cycles):

 OK, that is the theory. May not be a perfect fractal as I interpret the Kitchin being divided into 9 Wall cycles. Still I check EW sites from time to time to verify my analysis. I am not an EW analyst, but here is the latest EW counts according to my understanding:
 Hope - this enlightens. I feel cycles and Elliot Waves are two different approaches to extract the same information. I believe cycles are the simpler approach.
GL traders
GL traders
Friday, March 2, 2012
03-02-2012 recession ahead
I have noticed that recessions generally start when the economic numbers are at highs. Many people tend to project today's numbers into the future - which is why they are surprised when the economy takes a tumble. ECRI predicted a recession by the second quarter of 2012 back at the end of September. They have an excellent record in calling recessions. Now I could show you a lot of charts that claim to predict the future.
Instead I am going to show you one chart. It is not some prediction but shows the "data" (not some prediction) and is referred to a coincident indicator. It is on the verge of falling into an area that normally precedes or coincides a recession. Here is the chart:
 You decide, recession or not.
Instead I am going to show you one chart. It is not some prediction but shows the "data" (not some prediction) and is referred to a coincident indicator. It is on the verge of falling into an area that normally precedes or coincides a recession. Here is the chart:
03-02-2012 outlook
I believe the 20 week Wall cycle has topped. We could set a marginal new high today, but I believe the odds do not favor that outcome. That does not mean we immediately fall 100 points on the S&P. Why? Because the shorter qtr Wall (about 25TDs is now up as it just bottomed) and that will give us dueling cycles. I have tried to determine the likely result of this. Using DPOs for the Wall cycle (about 210 points and the qtr wall cycle (56 points) it appears they should almost precisely offset over the next 12 or so TDs.
As a result of this dominant cycle pushing down as another pushes up it would imply an increase in volatility. So there may be increased short term trading opportunities. Be careful and preserve your capital.
Here is the SPX and the outlook:
 GL traders. Let's make some money.
As a result of this dominant cycle pushing down as another pushes up it would imply an increase in volatility. So there may be increased short term trading opportunities. Be careful and preserve your capital.
Here is the SPX and the outlook:
Subscribe to:
Posts (Atom)