Wednesday, August 31, 2011

Outlook for 09-01-2011

I said in last evenings posted I felt at the end of the day the bias would be neutral.  We were up, but not by much (I'd call it neutral).  Looks more and more like a topping process. 

Of course the first couple of days of the month we normally get inflows from IRAs, 401Ks and pensions.  I expect tomorrow will reflect this, but I doubt the inflows will be enough to make a huge impact.  Still it could result in some up side push.

The 34TD cycle is down.  The 22TD cycle is up for 2-3 more days.  The 11.2TD cycle is down.  The 5.6TD cycle is topping and the 2.8TD cycle is bottoming tomorrow.  When you add it all up the bias continues to be neutral.  We may well test today's high again, but by the end of the day the market should be little changed.

Here is the SPX swing cycles:


Gl traders, be careful and take some profits off the table...

Bonus info - crossing of SMAs:


Yes, I look at things in addition to cycles and so should you.

Outlook for September 2011

August ended on a flat note (slightly positive).  The first couple of days of a month you normally get new money (IRAs, 401Ks, etc) into the market.  So it would not be unexpected to see that happen the first couple of days of September as the 22TD cycle tops. 

So the first couple of days could mark a high point for September.  Why?  It is the top of the last of the longer of the swing cycles the 22TD cycle.  The 22TD cycle will bottom the middle of September (Sept 16 or 18?).  Down now and expected to bottom the middle of September is the 34TD cycle.  Also down and expected to bottom the middle of September is the 67TD  (65-70) cycle. 

It appears with these cycles bottoming together the odds favor a new 2011 low in middle September.  Based on the DPO (trend amplitudes) that low point could be 200 points lower that the Aug 31 high of 1230 or 1030.  After that we should see a bounce into the end of September which I expect will recoup about 50% of any loss in the first half of September.

Here is a chart of the SPX showing these longer swing cycles:

If you liked August you may love September.  

Tuesday, August 30, 2011

outlook for 08-31-2011

I opined we would see weakness early in the day but would recover by the close.  Even a blind squirrel finds an acorn every now and then.  It appears we are now in a topping process.  The 34TD cycle has topped and turned down.  The 22TD cycle is up for another 2-3 days.  The 65-70TD cycle is also down.

The 11.2TD cycle is down.  The 5.6TD cycle is up.  The 2.8TD cycle should top during the day.  Maybe a bit of upside bias in the morning, but that should fade by the close.  For the day I suspect the bias is neutral.  Maybe during the day we test the 1228 level (see the target on the chart in my outlook for the week of 08-29).

Of course any upside is in question as we get the ADP and Challenger Gray & Christmas  employment releases before the market opens.  Not expecting any big up surprises here, but if it happens it could lead to a gap open.  Later we get a PMI and a Factory orders report.  These could impact the market  (and I expect one or the other or both will lead to a market pull back which would be consistent with the 2.8TD cycle topping).

Here is a chart of the SPX swing cycles:

Gl traders.  If the market is in a topping process it may be time to take profits and consider positions that would profit from a pull back.  Your money - do your own analysis before you decide. 

Droke on the 6 year Kress Cycle

http://www.safehaven.com/article/22357/the-6-year-cycle-peak-is-near

To provide a more detailed picture I will provide a chart showing the Kitchin cycle which is down and should be gaining downside momentum.  This combined with the 6 year cycle should make the last quarter of the year interesting (as well as the first half of 2012 - K-Wave preview?).


Hope this helps set the background for trading - trading the long side may get difficult.

Monday, August 29, 2011

outlook for 08-30-2011

A stronger move up than I expected.  Would not be unusual to see some consolidating here.  I would remind you though I mentioned a potential trend change: http://swingcycles.blogspot.com/2011/08/stage-set-for-trend-change-signal-vix.html  Since then we have gotten 3 consecutive up days (Aug 15 and Aug 24) to complete the trend change signal.  May mean we get a few more days up?  We'll see.

I said I thought we would test 1208 high.  Thought it would take a couple of days instead of one day.  Now the target I showed on the weekly chart at 1228 looks like it is more probable.

The 34TD cycle continues topping.  The 22TD, 5.6TD,  and 2.8TD cycles are up.  The 11.2TD cycle is down.  So the bias should be up tomorrow.  My guess is some give back early and a strong close.

Here is the SPX swing cycles:


GL  traders.  Bought some RWM (short Russell 2000 ETF) today, sold covered calls on the remainder of my longs. 

The week of 08-29-2011 outlook

As mentioned in my 08-29 outlook the 2.8TD and 5.6TD cycles bottom and turn up today.  That is somewhat supportive of the 22TD cycle which is up this week.  The 11.2TD cycle and 34TD cycles are down.  So into Wednesday we have somewhat an up side bias from this alignment.  This gives us a shot at testing the old 1208 high.  If we break above 1208 then we may see 1228 (but I consider that some what a long shot).

The 20 week (Wall) cycle is up, but the 67TD (65-70)  is down.  The 34TD cycle is topping and turning down, so by Wednesday this is combined with the 5.8TD cycle topping. By late week we should see a downside bias. 

In summary up side bias into Wednesday and downside bias the last half of the week.  Overall it probably gives us a flattish week.  By next week the 22TD tops and we have multiple cycles heading for bottoms by mid September (I will try to provide a monthly outlook soon).

Here is the SPX intermediate length cycles:

Gl traders - have a profitable week.

I use cycles as a primary tool, but I do look at other things.  The TRIX is a smoothed EMA and crossovers can offer some hints at key points.  Also the CCI at extremes (+125-150 sell?  -125 or less buy?) can often provide clues.  Here is a chart showing this:


Sunday, August 28, 2011

outlook for 08-29-2011

Last week I was telling you the bias was up.  I believe the Nasdaq actually closed up for the week?  Well, the only constant in the market is change.  As the 34TD cycle tops over the next couple of days the bias will become neutral and later in the week shift to down.   So on 08-29 we should have the 34TD  and 11.2TD cycles topping. The 2.8TD and 5.6TD cycles are bottoming.  The 22TD cycle remains up for about 1 more week.

Of the longer cycles the 67TD (65-70TD) cycle is down and the 20 week (Wall cycle is up).  Any upside bias (if any) should be fairly muted.  So Monday should trade sideways (may get into low 1190s and sink into mid 1160s) during the day.

Here is the swing cycles for the SPX: 

GL traders, don't get greedy.

Thursday, August 25, 2011

comments and outlook for 08-26-2011

Yesterday and early this morning were a bit of an overshoot, so a pullback was needed - which we got.  The bias still remains up for tomorrow.  Of course we have those two French people and Ben speaking at Jackson Hole.   Ben may be the lesser of the three as to what he has to say.  We will see - I suppose they could move the market.

Can we test the old high at 1208.  I think it is possible, but not tomorrow.  Here is the swing cycles for SPX:
GL traders, don't be greedy.

Sector rotation and what it says 08-25-2011

Deleveraging has affected every area of the stock market, but less so for utilities, consumer staples, and health care. These are defensive sectors in nature. According to the sector rotation model, they are the sectors that outperform in a bear market and early recession.

The sector rotation model is telling us that we are in a bear market and early recession. The key to listening to the sector rotation model isn’t so much of what is doing well now, but what WILL do well later. The next sector to outperform is financials.
 
http://www.financialsense.com/%20contributors/ryan-puplava/2011/08/25/sector-rotation-at-mach-speed

September Spiral dates

The large peak on the 25th with a 6.5 score – this represents 5 spirals aligned on the 25th: F5, F9, F10, F21 and F22, together with F18, and F19 on the 24th, and F13 on the 26th – is of great interest as it also falls two days before the new moon. As I wrote last month this is prime territory for the end of a panic or crash as shown in Chirs Carolan’s Autumn Panics: A Calendar Phenomenon. The exact timing (moon phases in EST) is for the new moon at 6:09am EST on Tuesday 27th September. The end of any panic is supposed to occur 55 hours earlier, plus or minus 12 hours, which is a window from 11am EST Saturday 24th, through 11am EST Sunday 25th right in the middle of the weekend. If it does turn out to be a panic, we might expect the market to close Friday after a steep decline, but then open with a bounce on Monday. Another interesting point is that the August 27th spiral score peak and the Sept 25th one are exactly F1 apart, so if we get a turn near August 27th, this would further reinforce the Sept 25th date. Both dates are in prime danger territory for a panic, and it’s not impossible that we might see two panics or at least large declines in a row a month apart, marking wave 3s of successive impulse waves down. Of course how the market behaves immediately prior to these dates is critical, so as always, predicting the direction of a turn too far ahead is difficult.

http://spiraldates.com/

The history of autumn panics:

http://www.mta.org/eweb/docs/1998DowAward.pdf

Wednesday, August 24, 2011

Comments and outlook 08-25-2011

Who would have thought it - two green days in a row.  Oh yeah - that is right I mentioned there should be an upside bias from the shorter swing cycles.   Well the upside bias should still be in place, but the higher we go the more likely we get a pull back.

All the shorter swing cycles except the 5.6TD cycle should be up tomorrow.  Of course, we have longer cycles pushing down.  Still I expect some more upside before the 34TD cycle tops on Monday and then it becomes more probable we get a turn down.

Here is the SPX swing cycles:

We closed the day right at a FIB level - keep them guessing.  I am watching RWM for entry under $33 (hopefully $32.50) and QID under $53 ($52 would be better).

GL traders.  Use stops to protect profits if you have them.

Tuesday, August 23, 2011

Comments and outlook 08-24-2011

Who would have expected the market to "pop" like this?  Well, besides me.  Hehehehe.  I told you that pressure was building under the market and to expect a "pop" and it would possibly be today.

I know, I know - what am I going to do for you now.  Well every day can't be like today.  Some of the upside pressure got relieved today, so I would not expect tomorrow to repeat.  Still the bias should be to the upside.  The short 2.8TD cycle will be down tomorrow.  The 5.6TD cycle should top. The 34TD, 22TD and 11/2TD cycles are up.  By Monday the 34TD cycle should top.  So over the next 3 days we should get some upside (target 1208?) before the trend starts to wane.

Here is the SPX:

Gl traders.  The bear is lurking and the longer cycles are getting less favorable every day but we continue to focus on shorter swing trade cycles.   

comments and outlook for 08-23-2011

The ECRI's WLI (Weekly Leading Indicator) has gone negative.  Most of the time once this happens we get an official recession.  Not much up side at the end of the day.  Still the market seemed to want to rally.  So the pressure is building underneath the market IMO.  We are overdue a substantial pop.  Could it be today?

Here is the SPX:


GL traders.  Be careful - bears are nearby.

Sunday, August 21, 2011

Comments and outlook for 08-22-2011

If I were in charge and wanted to try and halt the market slide I probably would provide news to divert attention from the potential sovereign and bank collapses in Europe and domestic economic troubles.  How would I do that?  Well Palestinians shooting Israelis and  a shooting war there could do the trick.  If Israel failed to respond properly and attack I might have to move to plan B.  How about have Libya falls and Daffy Duck flees?  That should divert attention a few days until Ben tells us on Friday how the Fed plans to inflate assets (stocks).  Of course a nice hurricane up the coast of Florida to the Carolinas wouldn't hurt either.  That is if I was in charge....  Might provide enough time for the Europeans to figure out another can kick down the road.

If as projected the 22TD cycle has bottomed we should get something of an up move Monday (because we have other news to divert the sheeples attention).  Here is the SPX short cycles:

GL traders.  Be careful, the bear is lurking close by.

outlook for week of 08-22-2011

A couple of the cycle analysts have come out with updates this week.  My last post gave you the URL for David Knox Barker.  Cliff Droke also has a recent commentary:  http://www.safehaven.com/article/22220/economists-refuse-to-recognize-the-new-great-depression

In general both of these analysts are saying we are entering a difficult period now or in the very near future.  They also expect this to last for some time with a bottom being set in 2013 or 2014.  If true this makes it much more difficult to win trading from the long side.  So you need to identify a couple of inverse ETFs in which to place some money.  RWM is one such ETF (Russell 2000 Index).  It is not a double (or triple) inverse so the decay factor is acceptable.  One acquaintance claims this should be a core long term holding for the next 2-3 years.

Now the market probably is not going back to 2009 lows (or lower) in the next week or month, but over a period of 2-3 years.  Our focus will continue to be shorter term moves.  Just realize that rallies are apt to be less robust and may often get truncated if as claimed by Barker and Droke we are entering a period of long term decline.

The 20 week (Wall) cycle should have bottomed the first week of August (see Barker's article) and now gaining some upside momentum.  The 34TD cycle should remain up for about a week.  The 22TD cycle should have bottomed this past week and now be up.   So there should be an up side push during the week.  If this happens use it to trim you long positions.  It may also provide a good entry into an ETF like RWM.

This up side push should top around the end of the month.  Here is the SPX:


GL traders.  The bear may be lurking in the shadows for a long time.
Bonus:  RWM chart:


Potential entry under $33.    

Thursday, August 18, 2011

outlook for 08-19-2011

It appears the 22TD cycle finally made itself known with a vengenance.  As I mentioned in my last post - it is OPEX and anything is possible.  Seems we got a delayed reaction to events in Europe.

So what happens tomorrow.  This morning seems to have set a bottom for all the shorter cycles.  We see for sure tomorrow.  As I have commented before the 22TD cycle may actually be 22+ days (22.50TDs) so bottoming today is not totally unexpected.  The fact we did not see much of a recovery by day's end leaves tomorrow questionable.  Still with all the shorter cycles (22TDs, 11.2TDs, 5.6TDs and 2.8TDs) turning up there is a good chance we will see an up day.

Here is the SPX:

GL traders.  Do your own analysis, very volatile market.

Wednesday, August 17, 2011

outlook for 08-18-2011

It is OPEX week, so anything could happen the next two days.  On the plus side though Barry is going to be on vacation and congress is out of town - so no one left in DC to screw things up. 

The shorter cycles bottomed today or early tomorrow.  The 34TD cycle, the 22TD cycle, the 11.2TD cycle, the 5.6TD cycle, the 2.8TD cycle now should all turn up.  So don't be surprised if tomorrow makes a move up above today's high.  Of course this assumes I have the cycles correctly positioned.

Here is the SPX:

GL traders.  Do your own analysis

Tuesday, August 16, 2011

Outlook for 08-17-2011

We may have seen some evidence of the 22TD cycle and its attempt to set a bottom today.  It should do that late tomorrow or early Thursday.  I expect another 20-30 points of potential down side.  Here is a chart of the SPX shorter cycles:

GL traders.  I hope actual market action matches expectations.

Significant bottom in October

http://www.safehaven.com/article/22193/coming-in-october-next-major-cycle-low

Could it be?

Monday, August 15, 2011

outlook for 08-16-2011

The last two days has seen volatility pull back somewhat and volume decrease.  Not seeing the expected sell down (expecting 20-30 points) due to the bottoming of the 22TD and shorter cycles.  Still it could happen over the next two days.  May have to examine the positioning of these cycles and if they shifted somewhat due to recent market activity?  Today was the 3rd consecutive green day - this should have generated a VIX trend change signal (to up).  This trend change can last a few days to a few months. 

Here is the SPX (short cycles):

GL traders.  Do your own analysis

Sunday, August 14, 2011

the week ahead of 08-15-2011

Last week was notable because we had 4 days with over 400 point moves.  That my friend is extreme volatility.  Can this continue?  I suppose it could, but the evidence suggests we have set a bottom for now.  Does that mean we go up without pull backs the coming week?  Of course it doesn't.

We have a 22TD cycle that should bottom by late Tuesday or early Wednesday.  But with the 20 week and possibly 3 year cycle having bottomed (at least I believe they have) there is an easing of downside pressure.  So we probably revert to +/- 100 point DOW days (+/- 10 points S&P).  So by Tuesday close I believe we could easily show a 20-30 point pullback to the 1150 area.  Once the 22TD cycle bottoms we should see an upside move into the end of the week (20-30 or so points up).  So if we lose 20-30 points in the first half of the week and regain them in the second half of the week  the week will be fairly flat.  Let's say we trade in a 50 point range for the week 1150-1200.

Here is an SPX chart:


GL traders.  Reality and projections don't always match.

Thursday, August 11, 2011

Post QE2 - how is it going?

Thanks to www.readtheticker.com/  for the following charts.  I believe they show we are following the Japan route with QE.


In other words I believe we have seen this movie.

outlook for 08-12-2011

Today appears to have completed the small inverted H&S pattern that I mentioned yesterday.  That implies we may get a pullback Friday.

Looking at the shorter cycles we see the 22TD cycle, the 11.2TD cycle and the 2.8TD cycle are down.  The 34TD cycle and 5.6TD cycle are up.  IMO the 20 week (4.5 month) and 9 month cycles bottomed.  But bottoming is a process and takes time.  The longer the cycle the longer the turn radius - so these cycles now should have little impact for some time.  See my prior post for a look at the remainder of 2011.

Based on the current cycle alignment it appears tomorrow should have a down side bias.  Here is a chart of the SPX:
GL traders.  Actual market performance may not fulfill expectations so be careful.

Outlook for the rest of 2011

We should currently be setting a bottom.  It that works out there should be a bit of a rally going forward as the 9 month and 3 year cycle turn.  Of course the middle of each month should be the bottom of the 22TD cycle.  So we rally a bit, pull back and then rally modestly for a couple of weeks into late August.  By mid September though we probably see lower lows as the 22TD, 34TD and 67TD (65-70TDs) cycles bottom together. 
After mid September the 20 week, 9 month  cycles are  gaining a bit of up side momentum.  The cycles that bottomed turn up.  So we should rally into the first of November (keep in mind the 22TD cycle will provide some weakness mid month October, but it may be muted as the 20 week cycle should top around Oct 19-20.  By the first of November we should have the 22TD and 67TD cycle topping together (this may be the high for the remainder of the year).

As we move into December we have the 22TD, 34TD and 67TD cycles bottoming around Dec 16.  The 20 week cycle should bottom around December  26 as the 9 month cycle tops (so I expect these to offset to a large extent).

Here are a couple of charts showing the referenced cycles and how they are expected to align for the remainder of the year:


GL traders.  As always do your own analysis, use this as a supplement/check of your analysis.

Wednesday, August 10, 2011

outlook for 08-11-2011

The volatility continued today.  I am looking for clues that a bottom may be in.  Looking at the 10 minute chart it appears we may be making an inverted H&S over the past 2+ days.  The left shoulder and possible right shoulders fit nicely the bottoms of the 2.8TD cycle.  The head could be the bottom of the 20 week and 9 month cycles. Today's close marked the potential right shoulder.  I would think by mid day tomorrow we will know if this pattern plays out.

There is no assurance this pattern plays out, but if it does we can start to feel a bit of confidence we have seen "a" bottom.  Will it be "the" bottom?  Not sure as I expect the 22TD cycle to bottom  next week around Aug 17 (or early Aug 18). 

If the longer cycles have bottomed and are now starting to turn I would expect their impact to be minimal as it will take some time for them to turn as they have at least a 1-2 week turning radius.  With that possibility in mind I looked at the shorter cycles.  The 2.8TD cycle, the 5.8TD cycle and 34TD cycle are up.  The 22TD cycle and the 11.2TD cycle are down.  So we may see some upside bias tomorrow.  We will see.

Here is the SPX:

GL traders.  Be careful - this is a high risk market and things may not play out as described.

Outlook for 08-10-2011

The market is searching for a bottom as we have some fairly lengthy cycles bottoming.  There is the 9 month cycle, the 20 week cycle (approx. 4.5 months) and possibly a 3 year cycle bottoming.  Now it is uncertain if they have already found a bottom or if there is a lower level that will be the bottom. 

As of now it appears 1100 may become a temporary bottom.  On the other hand there is the shorter 22TD cycle that should bottom around Aug 17 which may define the final bottom.  Volatility continues and  the very nimble trader may benefit from this, but it is a very dangerous game.

For the next few days I plan to watch, trade the market in front of me  (if it makes extreme moves) and not try and anticipate exactly what the market will do.  As I said yesterday - I believe the shorter cycles are of little value in providing guidance at this time.  I anticipate it will take some days for volatility to slacken so we can again focus on the shorter cycles.  So I will not provide visuals of the shorter cycles at this time as they are apt to be confusing or misleading at this time.

GL traders.  This is a high risk market (short/long) and stops are very likely to get tripped.  If you decide to trade be nimble, very nimble.

Monday, August 8, 2011

Outlook for 08-09-2011

I told you in my general disclaimer - at times I might miss something or misinterpret data.  It appears that I missed something and/or misinterpreted the data.   At this time the shorter cycles are having little or no influence.   So I took at look to see what I was missing in the intermediate length cycles,  So I reviewed some information on Gann and was drawn to the 270 calendar days as a potential cycle to investigate (this BTW is about 9 month or 40 weeks or 200TDs  - 2X the 20 week Wall cycle). 

With this in mind I looked at a chart of the SPX.  Here is what I discovered:


As a result of my investigation I believe the 9 month and 20 week cycle are bottoming together.  Based on amplitudes it appears this bottoming may be near completion.  So we may have bottomed or may bottom during the week. 

GL traders.  Sorry I missed the potential influence of the 9 month cycle.

From shadow:  http://tinypic.com/r/2ef17ba/7

Gann liked division by 8.  1/8 = 12.5% and .125 x 1370 =  171.25 and 1370 - 171.25 = 1198.75 target.

Sunday, August 7, 2011

outlook for Monday 08-08-2011

The futures are down a bit this evening.  Could be a lot worse.  The boyz will use an illiquid market like the futures to try and bag some bargains in the morning, then if the cycles are right they squeeze the shorts like an anaconda. 

We should have seen the bottom of the 20 week cycle (I believe).  I suppose the PTBs could test that low Monday.  So I expect a lot of the downside pressure to subside fairly quickly if we open lower.  Looking at the shorter cycles the 34TD cycle is up, the 11.2TD cycle is up.   The 22TD cycle is down, the 5.6TD cycle is topping and turning down.  The 2.8TD cycle is up.  Given the turning radius of the 20 week cycle it will have little influence for a while.  The 22TD cycle and 35TD cycle should offset to a large extent. 

So it appears the shortest cycles may provide some upside momentum.  Best guess is we start the day lower (as the boyz load the truck) and then we see a bounce and turn green.  I suspect we could see a moderate advance (5-10 S&P points) by the end of the day.  Guess it depends on how big a squeeze the boyz lay on the shorts.

Here is the SPX:

 GL.  Do your own analysis.  Very risky market here.

Saturday, August 6, 2011

The week ahead 08-08-2011

We have had a lot of volatility which has spiked the VIX (volatility index).  Friday after the close S&P downgraded US debt.  I suppose this could cause volatility to continue, but I suspect that the markets have already discounted this move by S&P.  So I am expecting a reduction in volatility next week as the market settles into a trading range for the week.

Best guess is the range will be no more than 50 points on the S&P.  If I am wrong about decreased volatility then the range could be a lot more. The first half of the week I expect we see an attempt to rally the market.  The 34TD cycle should be up.  I also believe the 20 week (Wall ) cycle bottomed and should turn up.  But the 20 week cycle has a longer turning radius so I suspect it needs some time to build upward momentum.  The 22TD cycle is down and should build to maximum down side momentum by the end of the week.  So by mid week I would expect we see the market to start giving back any gains it makes in the first part of the week. 

By the end of the week we should be fairly flat for the week  (+/- 10 S&P points for the week).  During the week we may rally to around 1228 (FIB level).  It may test this weeks lows but I think the 1175 level is more likely (FIB 1177.43).

Here is a chart of the SPX showing calculations based on cycle amplitudes:
GL traders.  Do your own analysis.  Very tricky market to try and trade, so be careful.


Friday, August 5, 2011

Looking back at the week of 08-01-2011

The extent of the sell down definitely exceeded my expectation at the beginning of the week.  Of course, I thought we would turn by mid week - which did not happen.  So I thought it would be wort while to try and identify what I missed.

To begin with there was the news out of Europe.  News can always be fly in the milk.  We don't know what the news will be or when it will occur   I believe the news out of Europe did impact our markets.  I also believe by the end of the week (new plan from the Euro zone)  much of that impact was taken out of the market as shown by the recovery off the mid day lows.

So I went to Stockchart.com and charted the DPO (Detrend Price Oscillator - attempts to remove oscillation of market due to cycles).  I was using the S&P. I detrended for the 20 week cycle.  Now I had anticipated that this cycle would bottom end of next week or early the week after, but it now appears it bottomed this week.  I detrended the 34TD cycle which bottomed mid week.  I detrended the 22TD cycle which topped Monday.

As a result we see the 20 week cycle contributed about 110 points of downside since its top (mostly in the past 1.5-2 weeks).   The 34TD cycle contributed about 80 points of downside since its top.  That is 190 points of downside.  The 22 day cycle contribute around 44 points of upside during this period.  So we have 44 - 110 - 80 or 156 points of downside over the past 3+ weeks since the top around 1356.  That gives us an objective of around  1200.  That leaves about 40-50 points of downside/recovery due to news.  So that means we overshot (and recovered) about 50 points to the downside.

Here is the chart of SPX from stock charts showing what I said above:

I want to thank Shadow7 for his suggestion I had the bottom of the 20 week cycle positioned incorrectly.  I encourage other readers to raise issues when they feel I may have missed something or am not interpreting data correctly.  I believe though if you study the chart it does explain the past week.
Hopefully I have learned from this......  

Thursday, August 4, 2011

comments and outlook for 08-05-2011

Maybe given my miss today I should give up on making daily calls.  Totally missed the call for today.  What happened?  Can't be sure, the next few days may clear up what happened.  Though - if you have been following the conversation between Shadow7 and I you know we have been discussing the timing of the 20 week cycle bottom.  We may have gotten that bottom today???

When it comes to longer cycles in theory most of the actual downside will occur in the last 15% or so of that cycle's down leg.  For the 20 week cycle that would be 15% of 10 weeks or about 1.5 weeks.  So I took a look to see what level we might expect based on the 34TD cycle and 20 week cycle bottoming this week.  This ignores the effect of shorter cycles  - I was looking for a possible explanation not exactitude.  The 20 week cycle has about 80 points of amplitude.  The 34TD cycle also has about 80 points of amplitude.  So that is about 160 points of potential down side if these  two cycles bottomed together.  We started this down turn around  1356.   1356 less 180 is 1176.   So this allows for some 24 points of up side from the 22TD cycle over this period. (which topped and turned down within the last 3-4 days.).  So this is a possible explanation - the 20 week and 34TD cycle bottoming together (within a day or so of each other).

Like I said - the next week or so should tell the story, I was not expecting these levels until mid August when I expected the 22TD cycle and 20 week cycle to bottom together.  So if the 20 week cycle has/is bottoming  the mid month bottom will be less severe than I expected.  Some of today's weakness may bleed into tomorrow, but we may have seen most of the selling for now.

So lets say we see some weakness early and then get some buying and close to the upside (this assumes we did see the 20 week cycle bottom).  Here is a visual of the shorter cycles:

Gl traders.  Do your own analysis and be careful.  Had stop stops hit today and avoided extreme pain.

Stage set for a trend change signal ($vix)

The VIX has now advanced over 97.5% from its low in late April.  That is the first requirement to get a trend change signal to "up".  The second requirement is to get 3 consecutive green days.  Now I have seen those green days come as soon as 3 days later.  On the other had I have seen it take weeks.  In late 2008 and early 2009 it took months to get a completed trend change signal (you would have avoided the complete meltdown) if you waited for the signal, because the prior signal in August of 2008 was a trend change down.

So it is time to be aware and watch for a trend change signal.  The trend change usually occurs  no more than 4-5 days after the signal  is completed and the 3 consecutive green days may even be part or the trend change.  Not every trend change will generate a signal, but when a signal happens it is almost 100% accurate. The signal does not predict the length of the change - it can be a few days to months.

See prior posts on this.

Wednesday, August 3, 2011

Comments and outlook for 08-04-2011

I told you late last week to expect more volatility.  I think you will agree that over the last 4 days we have gotten that.  This is typical as cycles make a final push to a bottom (or a top).  I was wondering how much bleed over we would get from yesterday's sell down and close near the lows.  It was considerable.  Still by the end of the day my long purchase yesterday was in the green and QID was below where I sold it.   My timing was not perfect (it seldom is), but I believe I cut back my short position at an acceptable level and increased my long exposure.

Expectations for the economic #s have been lowered enough that to beat or meet them should be no problem.  Today's ISM #s and ADP's employment #s were not good, but they did not result in continued sell down for the day.  So I do not expect much of a reaction to #s unless they are absolutely terrible over the next few days.  Of course, Europe could always blow up and that would definitely move the market down.

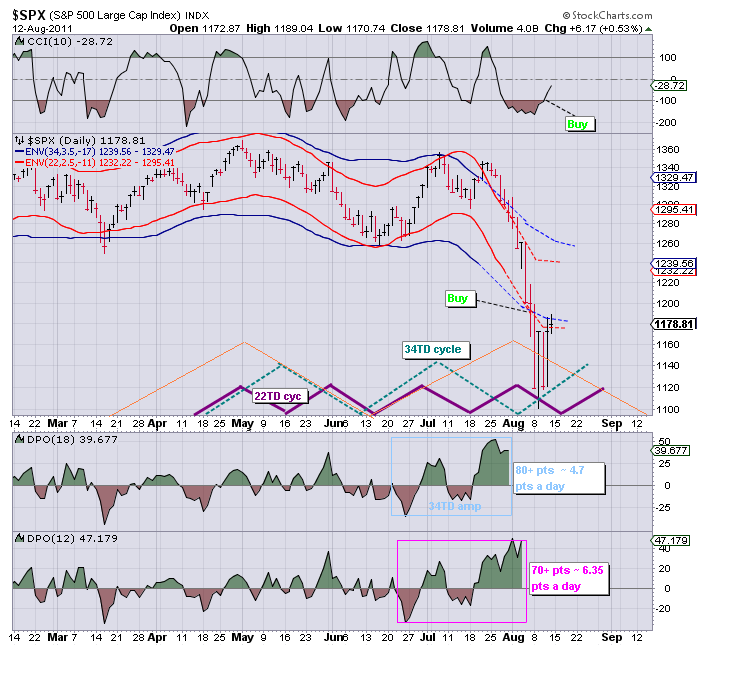
For tomorrow we have the 2.8TD cycle topping mid day, the 5.6TD cycle up, the 11.2TD cycle up and the 34TD cycle up (for about 3 weeks).  The 22TD cycle is down until around Aug 17.  If you have read the prior post and exchange between myself and Shadow you know there is some question about the exact status of the 20 week cycle.  I have it as down.  The 65-70TD cycle should also be down.

So I believe there is an upside bias, but given the position  of longer cycle (down) I would expect any move up to be moderate.  I think we will trade in a S&P range of  1247 to 1279 tomorrow and may end up by about 10 points on the S&P.

Here is a chart of the S&P (Note I shifted the cycles to the right by almost 1 day):


  GL traders.  Do your own analysis.  Be careful, any up move may be short term (5 or so days).

Wall (20 week) cycle - bottom today or in 2 weeks?

If you follow my posts and comments to those posts  you know that Shadow7 thinks the 20 week cycle bottomed today, whereas I have it positioned to bottom in about 2 weeks.  Now David Knox Barker is the authority on the Kitchin and Wall cycles IMO.  So see what he thinks:  http://www.safehaven.com/article/20555/tracking-the-wall-cycles-in-search-of-the-business-cycle-top-in-2011 (I believe this is his last article on the subject).  Now I copied the second chart inverted colors to make it more readable and added a couple of notations in the bottom right corner.  Here is Barker's chart with my notations:

Traders - you decide.  Now or in two weeks? Now I agree that the 20 week cycle has reached the point where it is starting to (should) exert maximum downside momentum.

Tuesday, August 2, 2011

comments and outlook for 08-03-2011

Was today a selling climax?  Hard to say, but it could have been.  Still, when the market ends near the day's lows it leaves one concerned about the next day and if there will be some carry over to the next day. Regardless - I sold the second of three tranches of QID today (like usual left too much on the table).  I also added to long positions (too early, but it could have been worse).  Yes Virginia - I do trade my analysis. So I am now about 2 X 1 long.

Was today the bottom?  It is always difficult to pinpoint the exact bottom, but according to my analysis today should have been the bottom.  Shadow thinks it will be tomorrow, and I would not argue with that as it is easy to be off by a day or so. If we get a 1-2% downside move tomorrow I expect I will increase my long to shorts to 3 X 1.  Yes, I generally hold longs and shorts, because like I said pinpointing turns is not exact.

Tomorrow the 2.8TD, the 5.6TD, the 11.2TD, the 34TD cycles should be up if I have them positioned correctly.  The 22TD cycle and 65-70TD cycles should have turned down.  The 20week cycle is down and should bottom around mid month.   Overall we should have a flattish day with an upside bias.  The range should be 1247-1279.  If we break below 1247 then the downside potential is around 1228.

Here is the SPX chart:

GL traders.  As always - do your own analysis and be careful. 

Monday, August 1, 2011

comments and outlook for 08-02-2011

We just keep getting bad economic #s - like the ISM #s today.  This is in addition to all the issues I mentioned over the weekend.  The MSM though is spending most of their time talking about the "deal" in DC.  Assuming the deal becomes a "done deal" it will be forgotten by the end of the week, but the economic #s just keep on giving.  Hehehe

Today started like a house on fire.  Somebody forgot to call the fire department and an hour later the house was ashes (after the ISM #s).  Of course, this was consistent with what the cycles were predicting.  By the end of the day the market recovered substantially.  I would like to point out even though we closed in the red the VIX was down over 6%.  Given the strength of the recovery the VIX may be telling us that today was the bottom?  It had that feeling.  So I think there is a good chance (close to 50%) that the cycles bottomed today.  If not the bottom should happen in the morning and the shorter cycles except the 22TD cycle will be up by the end of the day (the 22TD cycle tops and turns down).  Watch the pre-market and decide if you want to risk a long trade tomorrow.

I believe there may be indecisive action early and by the end of the day we should rally some and have an up day.  Here is a visual:

GL traders.  Do your own analysis.  Be careful.