Sunday, July 31, 2011

comments and outlook for 08-01-2011

As I type this the S&P futures are up around 16 points.  All based on the lame stream media reporting congress is close to a debt ceiling deal.  Are they?  Well, as I understand Senate rules it can take 2 days to get the final vote on any "deal" and they need 60 yea votes.  Then any "deal" is by no means assured of passage in the House without changes when it goes to the House.  So it seems to me you are looking at late August 2 or early August 3 before any "deal" is a "done deal" and possibly later than that.

Did you see that several large companies have been announcing cut backs.  I think you will see the weekly unemployment #s move back up.  I would not be surprised to see a 500K claim # within the next 2 months.  So all this market weakness is about more than the Kabuki theater in DC.  There is the problems in Europe, the GDP reports, and weakening employment situation.  See my weekly and monthly outlooks for additional comments.

Our cycle charts is showing Monday down.  How much?  Hard to say - may depend on how hard CNBC pushes the "deal" is done topic.  Still I believe we could test prior lows near 1260 within the first 2 days of the week as you have multiple cycles bottoming Tuesday (If I have the charts right).
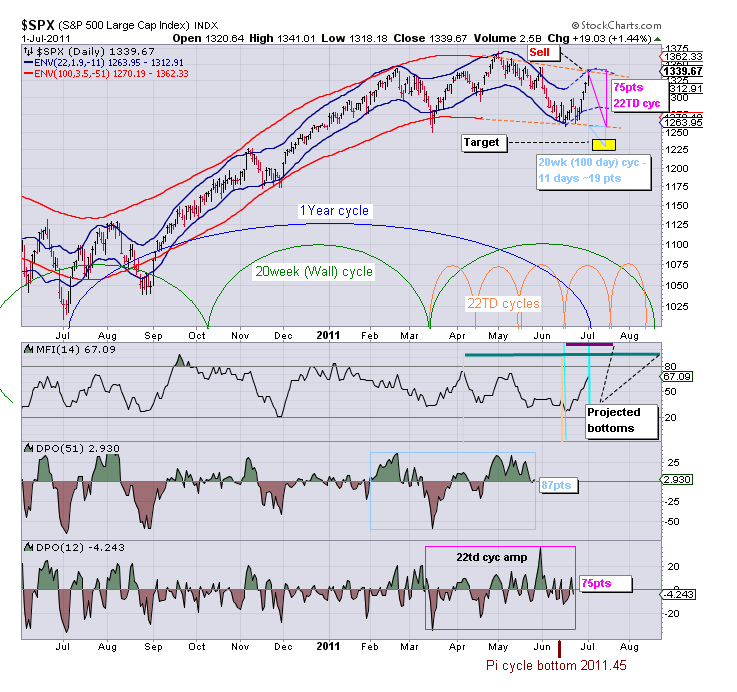
Here is a visual:

GL traders.  Do your own analysis.  Yeah - futures are up big - but it is still 13+ hours until the market opens.

Saturday, July 30, 2011

Sprial dates for August

Always interesting to compare to what we believe the cycles are telling us.

http://spiraldates.com/

comments and outlook for 08-01-2011

The Kabuki theater continues this weekend in DC.  Make no mistake about it - this is to distract you from what is really going on.  The situation in Europe continues to worsen.  Italy had to pull a longer term bond offering because there was no demand.  Interest rates in Italy and Spain are moving up.  The EU (ECB) bailout plan is too small to support the banks in these two larger countries (banks in these countries hold a lot of sovereign debt).  The Fed has been told not to offer the same level of interbank swaps as they did back in 2008-2009 crisis.  The EU is between a rock and a hard place with no plan for dealing with a financial freeze up in Italy and/or Spain.  If the European banks have to buy dollars in the open market the dollar will move up substantially as the Euro plunges.  NOTE:  money market funds have been reducing European exposure reducing the US$ available for over night lending in Europe. 

Then there was the GDP report last week.  The next revision almost surely will show negative growth in the first quarter.  And the FED has told us the second quarter weakened from the 1st quarter.  So you don't suppose the second quarter will be revised negative also do you?  So you see why the PTBs are giving us Kabuki theater to distract us.  But that can only go on a short time longer.  In my monthly outlook I pointed out to you the Kitchin business cycle should have topped in December.  You think that may have happened?

I came across a chart of GDP I think you will find interesting:

If GDP goes below 2% we have a recession.  No way - the PTBs tell us things are improving slowly.   Oops, didn't that just happen?  Would you like nuts or sprinkles on that double dip.  Okay, enough commentary.

We should see a bottom Tuesday during the day as several of the shorter and 34TD cycle bottom.  Once these cycles turn up we should see a rise off of Tuesday's bottom.  Interesting isn't it that our cycles show a bottom on Aug 2 - the day that most likely we see a deal done in DC.  After the bottom we likely will see some up movement for 2-3 days.  Friday could be flat to slightly up.

Here is a visual:

GL traders.  Do your own analysis.  You might want to try a long or two by Tuesday close (Wednesday open) but be careful and use stops.  Refer to my monthly outlook - any moves up are apt to be short (no more that 4-5 days) and limited. 

Comments and outlook for August 2011

The Kitchin business cycle is 42 months ideally (may vary from 3-5 years).  The bottom was around March 9, 2009.  So half a cycle to the peak would be 21 months to around Dec 9, 2010.  Given the revised GDP numbers for the first quarter and for the second quarter I think we are safe in saying we have seen a business slow down in the first half of 2011 (as we would expect if the Kitchin cycle peaked in late 2010).  So BIG picture is we now have the business cycle slowing down and that should last another 14 months or so if we get a 42 month Kitchin cycle. March  2009 plus 42 months is 3.5 years or September 2012.

Within the Kitchin there are 9 Wall cycles of 20 weeks.  The 6th wall Cycle of 9 should bottom in mid August.  In addition we have a 22TD cycle topping now (Aug 1-2) and bottoming around Aug 17.  The 34 TD cycle is bottoming now (Aug 1-2) and turning up.  The 65TD cycle is topping and turning down.  So in mid August we have the 22TD cycle bottoming along  the 20 week cycle.  The 65TD cycle  is down into mid August and beyond. 

So after Aug 2 (bottom?) we get a few days (my guess is 4-5 days) up from the 34TD cycle being up and after that the longer cycles along with the 22TD cycle abort any attempt to rally.   So I am looking for lower highs followed by lower lows in by mid August.  After the low in mid August we will get another attempt at rallying but you have the 65TD cycle still down.  The 20 week cycle will have turned up, but will take some time to gather upward momentum.  Finally the 34TD cycle will top the third week in August and turn down.  So I expect the rally after August 17 to be rather weak also (another lower high?).  This should play into a rather major bottom in mid September.

Here is a chart of these longer cycles:


The minor top in early August should be around Aug 8-9 .  The minor top in the second half of Aug should be around  Aug 25.  We should see a bottom the first 2 days of Aug, and another bottom around Aug 17.  There is a third minor bottom that should occur in early Sept.  The mid month bottom is the most significant bottom in August.  Here is a zoom in chart of the shorter cycles showing Aug:

GL traders.  I have tried to summarize August without being too verbose.  Do you own analysis.  Comments, feedback and your opinions always welcome.

Update 07-31 08:30 EDT:

Here is a graph of seasonal trends for August.  Compare it to our cycle outlook:

Thursday, July 28, 2011

Comments and outlook for 07-29-2011

Today's outlook was too pessimistic.  Still we closed down as the 34TD cycle dominance again overcame a rally attempt.  The 34TD cycle continues down for 2 more days (if I have it positioned correctly).

So we have the 20 week cycle still down and the 65-70 day cycle up (topping soon).  The 34TD cycle is down (bottoming soon).  The 22TD cycle is up (topping soon).  The 11.2TD cycle is down (bottoming soon). With all these cycles topping/bottoming we should see increased volatility over the next few days.

The 5.6TD cycle is down.  The 2.8TD cycle is up.    Overall I expect the downside bias to continue Friday.  Will we test the 1280 level?  Based on cycles it is possible, but probably not.  Of course if the news is negative on the debt ceiling  Kabuki theater anything is possible.

Here is the SPX:

GL traders.  Do your own analysis.  Get your long list ready, we should bottom early next week.

Wednesday, July 27, 2011

Comments and outlook for 07-28-2011

As I indicated in my 07-27 post it seemed the 34 day cycle (down) was starting to exert dominance (down).  It showed up in full force today.  Can this dominance last?  I believe it can 1-2 more days at least.

Today the 5.6TD cycle topped and is down tomorrow.  The 2.8TD cycle bottomed and is now up.  The 11.2TD cycle continues down.  The 22TD cycle continues up.  The 34TD cycle is down. The 65-70TD (3 month reporting cycle is up and will top soon).  The 20 week Wall cycle is down.

So if I am right and the 34TD cycle is dominating the bias tomorrow is down.  So we trade in a range of  1329 (maybe it should be 1310) to 1279.  I believe we could see some significant downside tomorrow, maybe not 1279, but 1290 definitely seems possible.

Here is the SPX:

GL traders.  Do your own analysis, warning bears in the area.

Tuesday, July 26, 2011

Comments and outlook for 07-27-2011

Today was flat and traded in a narrow range.  It hit the bottom of the expected range and traded mostly in the lower half of the range I posted.  I thought we might close slightly up, but the market sold down the last half hour.

Tomorrow looks like another flat day.  It seemed that last week the 22TD cycle was dominant, but it now appears the 34TD cycle has assumed dominance.  If true that gives a downside bias to the market the rest of the week.

The 34TD cycle is down, the 22TD cycle is up. The 11.2TD cycle is down.   The 5.6TD  cycle is up.  the 2.8TD cycle should top mid day.  The 20 week cycle is down, the 65TD cycle is up.  Overall the cycles cancel out (mostly).  But, I believe there is a slight down side bias and we trade sideways in a range of  1310-1342.

Here is the SPX:

GL traders.  Do your own analysis.

The Gann circle explained

Gann related the circle (360 degrees) the the year.  He divided the circle by 2/3/4/8/12 etc to give you  180, 120, 90, 45, 30 degrees (days) etc.  

Businesses report quarterly.  90 calendar days is the 65-70TD cycle (I suppose to be perfectly accurate Gann should have used a circle plus 5 degrees for 365 days).  65TDs is 1/4 of 52 or 13 weeks or one quarter.  Now one would expect a cycle to track this quarterly event.  Realize though this cycle may invert (good reports give you tops, bad reports gives you bottoms). 

45 degrees or calendar days is (360/8) is 33TDs (half a quarter).  Another cycle we are familiar with. 30 degrees or calendar days is 22TDs.  15 degrees is 11TDs.

I hope you get the idea.  Now if we plot this information on a circle and associated days of the year we end up with something like this:

Assuming I chose a valid starting point this gives you the dates you should watch for pivot points over the next year (0, 90, 180, 270 is the quarterly earnings cycles; 0,45,90,135,180,225,270,315,360 is the 33+TD cycles, etc) .
Does it work? Get back to me in 1 year.

Monday, July 25, 2011

An inverted H&S explained in terms of cycles - $HUI (updated)

How can an H&S (or inverted H&S) pattern can be explained in terms of cycle interaction? 

$HUI shows the interaction on the daily chart of the 20 week and 22TD cycles.  The LS is the 22TD cycle bottoming (the 20 week cycle is down).  Then the 22TD cycle turns up followed by the 20 week and 22TD cycle bottoming together (the H).  The 20week and 22TD cycles turn up, followed by the 22TD turning down (the RS).  Once the 22TD cycle bottoms you have the potential for a breakout to the upside as the 20 week cycle is up hard along with the 22TD cycle being up. 
This is how an inverted H&S is formed  and is interpreted in terms of cycles.  Do inverted H&Ses work?   Often they do, but be aware a 3rd or 4th cycle may interact to  counter the action of the primary cycles involved in forming the H&S and  at times you will see them fail.  Now if we look at a weekly chart of $HUI the H&S pattern does not show up because the 22TD cycle is not very evident on the weekly cycle.  The 20week cycle is still quite prominent.  GL traders - I hope you find this informative and helpful when doing your analysis.

Looks to be progressing much as projected....


Comments and outlook for 07-26-2011

Today was basixcally as expected - down early with some recovery.  Tomorrow  the 34TD cycle continues down and the 22TD cycle continues up.  The 11.2TD cycle should have topped today and be down tomorrow.   The 5.6TD cycle and 2.8TD cycle should have bottomed today and turned up.  The 65-70TD cycle is up and the 20week cycle is down. 

So we have 34TD, 11.2TD, and 20 week cycles down. The 65-70TD cycle, the 20TD cycle, the 5.8TD cycle and 2.8TD cycles are up.  That is 3 cycles down and 4 cycles up.  This should result in a largely sideways market (1329-1349 range).  I believe the market will end up at the end of the day.

Here is the SPX (I added FIB lines for reference):


Gl traders.  Do your own analysis

Outlook for week of 07-25

Here is a couple of charts from Shadow:

It appears Shadow expects an up week.


And a continuation up for the next 3-4 months.

According to my chart - the week will probably be up.  See FIBS table posted on 07-25 daily outlook for possible targets.  There should be a pullback into mid August as the 22TD cycle bottoms and a more severe pullback in mid September as multiple cycles bottom.  Here is my chart:

GL traders

Updated chart from Shadow:
Shadow - this may sound silly, but what if you shift everything back 1 day.  The Tuesday action (as shown on your chart) is more of what I expected (and basically wgat we got) for today. 

Comments and outlook for 07-25-2011

A weekend of Kabuki theater from DC had the pundits speculating about a possible severe market sell off Monday.  Still I look at cycles to project not the news out of DC. 

Monday it appears we should at least start the day to the downside.  The 34TD cycle, the 5.6TD cycle and 2.8 TD cycles are down.  I expect the 5.6TD cycle and 2.8TD cycle to bottom by day's end.  The 11.2 TD cycle is up and should top by day's end.  The 22TD cycle is up.   The 22TD cycle has shown unexpected strength so far.  The 65-70TD cycle is up and 20 week cycle should be down.  So we start the day down, but may see some recovery by the end of the day.

Here is a visual of the SPX:

The suggested range (from the FIBS) is between 1361 and 1329.  Here is a FIBS table:
GL traders.  Do you own analysis and be careful.

Thursday, July 21, 2011

comments and outlook 07-22-2011

Sure did not anticipate the run today - seems the bailout news from Europe popped the market from the open.  Sometimes the news wins and the cycles lose.

Tomorrow the 34TD cycle is down, the 5.6TD cycle is down, the 2.8TD cycle is down.  The 22TD cycle is up.  The longer cycles (20 week and 65-70TD cycles) are down.  So the bias should be down.  Maybe we take back today's gain? Of course we could always get a debt ceiling agreement tomorrow....  or not which could hit the market.

A visual of the SPX:

GL traders.  Be careful buying dips Friday.

Wednesday, July 20, 2011

Comments and outlook for 07-21-2011

Well, it was a dull day.  Thought we might push a bit higher - and at times today it looked possible, but we closed down slightly (I'd call it a flat day).  Given AAPL's results you would have thought the techs would be up, yet the NAZ was the worst performer.  INTC had good results which may support techs tomorrow....

Tomorrow we have the 2.8TD cycle bottoming and the 5.6TD  topping.  The 11.2TD cycle is up.  So is the 22TD cycle.  The 34TD cycle is down.  The 20 week and 65-70TD cycles are down.  I believe the cycles largely offset giving us a neutral bias.  So I expect movement in a fairly narrow range (now that I have typed that we get a big move up or down).

Here is a visual using SPX:

GL traders.  Do your own analysis.  Short any big move up?  Buy any big move down?

Update - chart from Shadow:

Tuesday, July 19, 2011

Will AAPL run 07-20-2011

Looks like it should top within 2-3 days.  Take a look for yourself:

Comments and outlook for 07-20-2011

Update 11:00 am EDT - Sideways, bias neutral so far.

I had the direction right for Tuesday.  The extent of the push up (aided by a possibility of a deal on the debt limit) was more than anticipated. 

Well AAPL just WOW ed  with their earnings report, so expect this to boost the tech sector tomorrow.  The 11.2TD cycle is still up.  So is the 5.6TD cycle.  The 2.8TD cycle should be down.  The 22TD cycle is up and the 34TD cycle is down.  The longer 20 week and 65-70TD cycles provide some downside push.  The cycles should have an up bias tomorrow and AAPL will help accentuate that bias. 

Here is a visual using the SPX:

GL traders.  Go with the flow, don't fight the trend.

Comments and outlook for 07-19-2011

Update 2:04PM EDT  Sure looks like yesterday was a bottom......

It appears we got a 22TD bottom yesterday.  If true then that cycle is turning up.  The IBM report and outlook  last evening should provide some support in the tech sector.

So we have the 22TD cycle up, the 11.2TD cycle up, the 5.6TD cycle up, the 2.8TD cycle tops during the day.  You have the 34TD cycle down along with a couple of longer cycles (20 week and 65-70TD cycles) providing  some downside counter to these shorter up cycles.  So we have an upside bias, but IMO the upside potential is limited.  We well could recoup yesterday's losses.

Here is a visual using the SPX:

GL traders, do your own analysis.  The market continues to be choppy and move sideways so if you are trading it take those 1-2% profits as they become available (don't get greedy).

Saturday, July 16, 2011

chart by shadow

Shadow thanks for the chart.   What is the S&P value that equates to zero?  I am guessing around 1340-1350 range  ( the longest blue line down: 1345 - 85 = 1260).

I guess I am asking what is your high and low on the S&P using your chart.  Appreciate any enlightenment you can supply for interpreting this.

I hope I responded to all your prior comments.  As I have stated in the past the purpose of the blog is to educate as well as to inform.  People like yourself who take the ball and run with it will profit the most I believe.  Others at least will be familiar with cycles (and hopefully recognize one when it stands out).

Again - thanks for contributing.

Updated 07-18 11:55

Additional charts referenced in Shadow's comments (reference them for context): 

comments and outlook for 07-18-2011

As I pointed out in my outlook for the week the 22TD and 34TD cycles largely offset (as does the 65-70TD cycle and the 20 week Wall cycle).  So this gives us a  background for a sideways market.

The 22TD cycle has bottomed or should bottom no later than Monday and turn up, offsetting the downside from the 34TD cycle.  So all the action is going to be related to the shorter cycles.  The 11.2TD cycle is up Monday.  The 5.6TD cycle is also up Monday.  The 2.8TD cycle is down an should bottom by Tuesday morning (if I have the cycles correctly positioned).  So any weakness on the close Monday or Tuesday morning may offer a 1+ day trade to the long side. 

Here is a visual of the SPY:

GL traders.  If you decide to trade this market next week - keep your stops fairly tight and don't get greedy (take those 1-2% gains).

Comments an the week of 07-18-2011

Seems I may have gotten back in sync with the cycles and which are dominant at this time?  Looking at the SPX and the 22TD and 34TD cycles it appears the 22TD cycle may have bottomed (and at the latest should bottom Monday).  The 34TD cycle topped 6-7 days ago and is down for the next 10-11 trading days into the end of July.

The DPO (cycle amplitude of the 22TD cycle is about 50pts over 11+ days.  This is about 4.5 points a day to the upside next week (and into the end of July).  The DPO of the 34TD cycle is about 60 points or about 3.5 points to the downside each day.  So these 2 cycles provide about 5 points of upside for the week.


Next, I looked at the 65-70TD day cycle (13-14 weeks) and the 20 week (Wall) cycle.  The 20 week cycle is down.  The 14week cycle is up.  So these 2 cycles like the 34TD and 22TD cycles will offset to a large extent.  Looking at the DPO for the 14 week cycle  it provides about 8.50 points to the upside for the week.  The 20 week (Wall cycle) provides about  9 points to the downside for the week.  So maybe 1 or so points of downside potential for these 2 cycles.

In summary the week looks flat and shows the potential to end 4-5 points higher for the week  as I interpret the charts.

GL traders.  As always, do your own analysis,  Sideways markets can offer some decent short term trading opportunities - day trading or a 2 day trade.  You will need to look at shorter cycles to try and get the best entries and exits.

Friday, July 15, 2011

comments and outlook 07-15-2011

GOOG earnings were a WOW!!!  This should help support the NAZ.  If as I believe the 22TD cycle is due to bottom and with other shorter cycles having bottomed then we should get some upside pressure.  Some longer cycles (including the 34TD cycle) are down.  So we get a lot of offset from the opposing directions of the cycles.

The 34TD cycle is down.  The 22TD cycle is bottoming.  The 11.2TD and 5.6 TD cycles are up.  The 2.8TD cycle should top during the day.  So it will probably be a range bound day with an upside bias.

Here is a visual: 

GL traders.  Do you own analysis.


Thursday, July 14, 2011

Comments and outlook for 07-14-2011

If you had looked at the futures yesterday after the close (after Moody's put US treasuries on a watch) you would have thought today would be a big down day.  I sold some QID about $1 above the close. Yet, this morning the market looks flat to slightly up.

Here is a visual:

Looks like the 34TD cycle is down.  The 22TD cycle should be bottoming by/before the end of the week.  Some of the shorter cycles should bottom during the day.  Based on this visual one might expect some weakness mid day and some recovery by the end of the day.  So flat to slightly down would seem to be the most likely outcome for the day.

GL traders. Do your own analysis.  Take a look at Shadow's comments.

Tuesday, July 12, 2011

comments and outlook for 07-13

Update 07-13 10:30 am EDT - Appears I still have the cycles shifted off by 1 day and yesterday was the short term bottom?

Looking for a short term bottom tomorrow as all the short cycles including the 34TD cycle are down.

Here is a visual:

GL traders.  Do your own analysis. Beware of the bears.

Monday, July 11, 2011

Comments and outlook for 07-12

OK, today was down not sideways.  Looking more and more like last Thursday was the top of the 34TD cycle.  That would put the last bottom around June 13.  17 trading days from last Thursday would put the 34TD bottom around  July 29 or Aug 1.  Of course there is a 22TD bottom in mid-July.

So I have adjusted my short term chart to reflect Thursday as the top.  After this adjustment we have the 34TD cycle down, the 11.2TD cycle down, the 5.8TD cycle down and the 2.8TD cycle topping.  And of course the 22TD cycle is down about another week.  So this does not paint a rosy picture for the bulls and tomorrow could/should continue the downtrend of the past 2 days for another 2 days.

Here is a visual:

GL traders.  I hope I finally have the cycles correctly positioned.  Warning: do not feed the bears.     

Sunday, July 10, 2011

Comments and outlook for 07-11-2011

If you have been following the thread of posts you know that there appears to have been a change in the dominance of cycles.  It appears that the 33-34TD cycle has resumed a dominance.  The 22TD cycle probably will still show some impact as it bottoms mid-month, but not to the extent as previously assumed.  The 33-34TD cycle should be topping and bottom about 18TD days from now (early Aug).

So Monday the 34TD cycle should be topping.  The 11.2TD cycle should also be topping.  As these 2 cycles top the 5.6TD  and 2.8TD cycles are bottoming.  The 1 year cycle bottoming was evidently more than offset by the strong up move by the 34TD cycle over the past few days.  As I mentioned the 22TD cycle should bottom mid-July.    Over all it looks like a sideways day for Monday with possibly a slight downside bias.  Note:  there may be negative news coming out of Italy which could add to downside pressure.

Here is a chart showing relevant shorter cycles (hope I have them properly positioned):

GL traders.  Watch for the bear.  Do your own analysis.

Friday, July 8, 2011

Comments and the outlook ahead 07-08-2011

If you have not done so I encourage you to look at the comments by Shadow on my last post.  He has some very insightful comments.

I have taken some of those insights and tried to represent them in chart format.  Here is that chart:

GL traders.  Any errors in the chart are by the author not Shadow.  I appreciate the contribution of him, Best and others in my effort to offer you the best information possible.

Thursday, July 7, 2011

comments and outlook for 07-08-2011

Missed posting yesterday, sorry about that - was having some back muscle spasm issues and could hardly sit up.  Today I think cleared up some things.  With today's move up I think it is clear the 22TD cycle is no longer in play. 

Now as was discussed some months back when we switched from 34TD (33.75 so it is often referred to as 33TD cycle) is back in play.    If that is the case it may not top before the middle of next week (and would not bottom until in early August.  I have not done the analysis yet, but last time the 33-34TD cycle nested within the 20 week (Wall) cycle which is 100 days or 3X the 33-34TD cycle.  I have never seen the 22TD cycle and 34TD cycle dominant at the same time...  I suppose it could happen.

I have annotated the SPY chart showing this assumption.  The 34TD cycle should be up, the 11.2TD cycle should be up,  The 5.6 and 2.8TD cycles should be down.  This should result in a somewhat sideways day Friday.

Here is the chart:

GL traders.  I hope we are now in sync with the cycles.  We will know in the next 4-5 days, but should have hints along the way.

Wednesday, July 6, 2011

Comments and outlook for 07-06-2011

Not much to add to yesterday's outlook.  The market action fits within my theory of the cycle alignment from yesterday.  Now we see if it continues.  If it does then today should be down.  How much?  Maybe 1% on the S&P.

Here is an updated SPY chart:

GL traders.  Be careful.  The market is never as predictable as we would like.

Monday, July 4, 2011

Comments and outlook for 07-05-2011

This past week is probably the worst week I have had since I started my blog when it comes to getting it right.  So what has changed?  What am I missing?  These are the questions I have been asking myself.

So I have looked at the placement of the 20 week cycle and adjusted its placement.  Not sure of the placement still.  That alone though should not account for the action we saw this past week. I expected the 22TD cycle to top on Thursday (but given it is probably actually 22.5TDs Friday was possible).  The 22TD cycle alone should not account for the amount of rise we saw in the market as we should have had at least some downside pressure from the 1 year cycle as it should bottom this week.

So I ran through several different possibilities, and may have found a possible answer.  Based on prior assumptions the chart would look like this: 

But this does not explain a move up that was extraordinary and one has to look back several years to find a comparable movement in a single week.  You have the 22TD cycle up, the 11.2TD cycle down.  These two cycles would be expected to offset.  So we would expect up/down movement based of the 5.6TD and 2.8TD cycles.  Instead we went up with little or no pullback all week.

So I cane up with a theory that may explain the data as it exists.  What if the 11.2TD cycle shifted 5.6 days so that it and the 22TD cycle were both up last week?  Many cycle analysts refer to this as a cycle inversion.    Then you would have something like this: 

You have the 22TD cycle up (it has 70 points or so of amplitude or 35 points last week) and the 11.2TD cycle up  and it has as much as 50 points of amplitude.  This gives you the potential of 85 points upside last week,  So the fact we got 75 or so points to the upside is accounted for and allows some downside for the 1 year cycle.  As I said - as of now this is a theory that seems to fit what happened last week.  Time will tell if it is the right theory.  If it is right then we now have both the 22TD cycle and 11.2TD cycles down and we should see downside in the coming week starting tomorrow.  It may start with a minor pullback (say 10 points or so on the S&P) and should accelerate through the next 4 days into next Monday if my theory is correct. 

If you have a theory (on cycles) that explains last week's action as well as this or better I would very much like for you to share it.

GL traders.  Do your own analysis.  Feel free to share you ideas and thoughts with others who visit this humble blog. 

Saturday, July 2, 2011

07-2011 the month of July

Would it be interesting if we have seen the highs for the month of July already?  Could happen, but we probably get enough upside Tuesday morning to keep that from happening.  The most interesting cycle in July will be the 22TD cycle.  This cycle has shown enough volatility (amplitude) to dominate in July.

The 22TD cycle should have topped and be ready to turn down.  With an amplitude of 75 points (estimated) by mid-July that could take the market back down under 1270.  The second most interesting cycle is the 20week cycle.  It has an amplitude (estimated) of 87 points.  That is about 1.75 point per day over the 10 weeks (the down leg) or about 19 points over 11 days of the 22TD cycle down leg.  That combined with the 22TD cycle could put the market at 1245-1250 by mid-July.   Now I am not certain of the impact, but the 1 year cycle is ready to bottom and may add another 15 or so points of downside next week.  After mid July the 22TD cycle should recoup a lot of the downside back up to the 1290 area by the end of July is my best estimate.

So in mid July we should be around 1245 (and maybe 1230).   Looking at the FIBS I believe the maximum upside target should be 1361.06 (but may be 1341.67) and the minimum downside target should be 1328.18 (but may be 1247.56).  Here is a fibs table: 

Here is a chart of the SPX highlighting the 22TD and 20 week cycles:
Note the target using DPO to estimate amplitude down from current levels gives a target of 1225-1235.  If we go up another 10 points from here the raise that downside target 10pts etc.  But the downside target is consistent with  with the FIBS mentioned above.

GL traders.  Is there a 4th of July bear out there.  I guess we will see.  Do your own analysis, this should only be one data point in your analysis.  Happy 4th....