Monday, May 30, 2011

comments and outlook for 05-31-2011

I mentioned in my weekly outlook we may be seeing the reappearance of the 34TD cycle.  It will take some more time to confirm that (or not confirm it).  But we can project based on it not re-emerging and we can project on it re-emerging.

First let's assume that the 34TD cycle is not coming back into play.  In that case we have the 22TD cycle up, the 11.2TD and 5.6TD cycles down. The 2.8TD cycle is up but should top by day's end.  So that is 2 up and 2 down...  My opinion is that could lead to some downside early and a bounce back later for a reasonably flat day.

Here is a visual for that scenario:

The second scenario is that the 34TD cycle is back.  This means some of the shorter cycles may have truncated and shifted into this new reality.  This means the 34TD cycle is up, the 11.2TD cycle is up, the 5.6TD cycle is down and the 2.8TD cycle is up and should top during the day.  In this case I would expect the market to move up early and possibly pull back once the 2.8TD cycle tops.

Here is a visual:
  
So tomorrow's action may provide us a data point that points us a little to the left or a little to the right.  I am inclined to think the 34TD cycle is coming back.  At this time that is more a hunch than a conviction. So I am going with up early and then down (still not a lot of movement).

GL traders.  Your money, you decide.

Friday, May 27, 2011

TKLC as of 05-28-2011

Received a request to chart TKLC.  Looks like it is topping and should be exited for the time being.  Here is the requested chart:

GL traders.  Do your analysis - Joe has.

comments and outlook for week of 05-31-2011

Strange week.  Started out like we might have a serious sell off and spent the next 4 days recouping most of the first day's loss.   It doesn't feel like it but we have had 4 down  weeks on the S & P 500 in May.  This week it lost about 2 points for the week.  On average it has lost about .5% a week (7-8 pts) in May.Feels like the market has gone nowhere in May (and with all the moves down and up - it hasn't moved much) - a little over 2% for the month.

My task is to try and interpret the data and inform you as best as I can what to expect in the coming week(s).  An interesting development this week.  It appears the 22TD cycle may have faded out of the picture and the 34TD cycle is back.  It will take a couple of weeks to be surer of this, but for now that is how the data (and charts) appear.  Not unusual for a cycle to fade after 3-4 complete cycles, but the 22TD cycle may be fading out after just 2 complete cycles.  We will see.

Now I often have an opinion on how the market will behave based on what I believe are the prevalent cycles.  If the data changes I try and change that opinion. If the 34TD cycle is indeed back it will not top for a couple of weeks (mid June).  So that 2% we lost in May could well be recouped by this cycle in the first half of June (1360 S & P?).  This changes my view of June as I had previously expected it to be mostly down.

Longer term though it still appears we have a nesting of cycle lows in early to mid July.  So maybe we get one more move up toward the peaks and then down hard into July.  That seems to be the indications from the current data and cycle positioning.  

Here is a visual:

GL traders.  Do your own analysis.

comments and outlook for 05-27-2011

The day was a bit greener than I expected.  Still, it traded pretty much within the expected range.  The downside pressure of any longer cycle continues to build and I do expect soon we will get a big down day that will set new lower lows.

Today - looking at the shorter cycles - the 2.8TD cycle topped yesterday and is down, the 11.2TD cycle is down.  The 22TD cycle is still up (about 3-4 days to a top).  The 11.2TD cycle is down (about 3 days to a bottom)..  The 5.6TD cycle is up but should top by end of day.  So we have a mixed situation.  I expect downside pressure during the day - maybe an attempt to rally by the end of the day...  For the day I expect the S & P to be down.

Here is a visual:


GL traders.  Do your own analysis and be careful.

Wednesday, May 25, 2011

Comments and outlook for 05-26-2011

Today was another relatively calm day.  The downside pressure from the longer cycle (1 yr) down leg continues to accumulate.  At some point that energy will be released as the spring snaps back.  The longer it builds the more severe that snap back is apt to be.

For tomorrow the short cycles are mixed.  The 2.8TD will top by midday.  The 22TD cycle and  5.6TD cycles are up.  The 11.2TD cycle is down.  some upside expected the first half of the day and then possibly a fade after the 2.8TD cycle tops.  So I expect moderate action from the shorter cycles with a flat to down close.  But, I have no idea if the 1 yr cycle down leg will kick in tomorrow or not - if it does then we could break some downside support levels.

Here  is a visual of the shorter cycles:
Gl traders.  Do your own analysis, stops are recommended.

LDK 05-17-2011 - update 05-26

Someone suggested I look at LDK.  It appears LDK is at a 22TD bottom and normally that would suggest a potential buy.  One problem is there is a longer cycle (6 months) that is also near a bottom (about 1 week).   Now it may get a bounce off the 22TD bottom, but I suspect that the 6 month cycle needs to bottom first to get a serious upside run.

Here is the chart:

GL traders.  Do your own analysis.

05-26

Updated chart.  It appears LDK has/is bottoming.  The first upside target (about 3 weeks) is around $8.

GL - do your own analysis

Tuesday, May 24, 2011

Comments and outlook for 05-25-2011

Today was a relatively calm day, up early and a fade during the day.  I expect the longer cycles will continue to build  up downside pressure tomorrow, but you have the 3 shorter cycles up and one topping.  Do we have another day with limited movement (as the downside pressure builds from the longer cycle)?   This longer cycle down pressure could kick in at any time.  That could be tomorrow (futures showing a lot of red) or the day after, but I believe it will happen soon.  Hard to get a fix on exactly when this will happen.   If you are long use trailing stops.
Here is a visual:

GL traders.  Do your own analysis.

Monday, May 23, 2011

comments and outlook 05-24-2011

Today a lot of built downside pressure got released.  After such an event at least a small reversal is normal.  And we got a bit of reversal late in the session.  We may get a bit more early tomorrow.  After all the 22TD  and 11.2TD cycles are up.  The 5.6TD and 2.8TD cycles are down. So we would not expect much of a move either way from these cycles.  So I expect later in the day the longer 1 year down leg may again assert itself (but not to the same extent as today). 

So I think we see some up early and late down later in the day.  1310 seems to me will provide support (see lower trend line on chart, and it is a FIB number):

I believe I incorrectly stated the position of the 20 week (Wall) cycle the last time I spoke of it.  So I have provided a chart showing the longer cycles that are influential at this point:


Gl traders.  Do your own analysis. 

comments and outlook for 05-23-2011

The outlook for Friday - not a good call.  It seems that expectations based on the shorter cycles are not being realized.  So this leaves me conflicted....  The short cycles should be up, but the market seems to want to go down.  To me this indicates that longer cycles (the 1 yr down leg?) are taking control.

So I am going to make a judgment call - I think we somewhat ignore what the shorter cycle are telling us and go with the evidence that they are being dominated by the longer term market cycle momentum.  I showed you on one chart in my weekly outlook where MFI was projecting a bottom at the point where the 22TD cycle should be topping.  I also think with the 1329 FIB (just below Friday's close) there is a better than even chance we break below that and if we do the market could easily fall to 1310...

The short cycles are up, but in my judgement the momentum is to the downside.  So that should give us a down market. Probable some time during the day the bulls push  up, but the bears win the day. Keep in mind the 1 yr should be hard down at this point and the 20wk has topped or is ready to top.  In short more volatility with a down bias.

Here is a visual of the shorter cycles:


GL traders.  Do your own analysis.  I can and have been wrong before - and it was difficult to make a call in predicting the action for Monday.


Saturday, May 21, 2011

Spiral dates for June

http://spiraldates.com/2011/charts/scores_0611.png

this is for you c_k....

WLT outlook 05-22-2011

WLT appears to have just put in a 22TD cycle bottom and may be good for a swing trade.  Here is the visual:

GL traders.  Do your own analysis like Susie has. 

Friday, May 20, 2011

comments and outlook for week of 05-23-2011

Last week's outlook was not all that great.  Yeah, looks like we bottomed as expected (but 1 day earlier than actually expected).  And we had some upside by the end of the week (but fell Friday).

Looks like things are getting funky.  I do a projection using MFI and looks like it is projecting a bottom the first 2-3 days of June, yet that should be the top for the 22 day cycle....    As I have mentioned for the past couple of weeks there is a 1 year cycle that is getting into the time frame on the down leg where it may dominate.  This may explain the contradictory indications.  One theory is the most of the downside of a longer cycles happens in about the last 15% of the down leg.  For the 1 year cycle that would be 26 weeks for the down leg and 15% of that is 4-5 weeks (more or less). 

So the situation next week is we have the 22TD day cycle pushing up, but may have the 1 year cycle beginning to push down hard.  Also the 20 week Wall cycle should be topping.  My guess is we may get some upside earlier in the week and run out upside momentum by mid week as the Wall cycle tops.  We need to watch closely - because if this is the case we need to get out of the way of a probable pullback that could last into July (maybe early August).  Based on the 22 day DPO it appears that the last top may not be reached.

Here is the SPX shorter term chart:


I took a look at some FIBS.  Thursday was just above the FIB of 1341.67.  Friday did not hold above that level.  This level has to be exceeded and held if we expect a run at the 1361.06 FIB.  Last top exceeded, but could not hold above this level.  If we can get above 1361.06 and hold say for 3 days we can make a run at 1392.43 or 1402.02.  On the downside the FIBs to watch are 1329.69.  If we can break below that and hold below it for 3 or so days we will probably fill the gap and go to 1310.30.  If we can break below 1310.30 then watch out below?

Here is a chart of the FIBS based on the 1982 low and 2007 high:

I expect by the end of May we will have a good idea of how the market is going to respond by watching these FIBs.  I also looked at a weekly chart of the SPX.  It is my belief that the 1 year cycle down leg will show up with strength possibly within the next week.  If that happens  we should see a convincing break of the 1329 FIB level.

Overall I believe we could see some (not a lot) of upside early in the week and get a reversal before the end of the week.  Here is the weekly SPX chart:

Gl traders.  Do your own analysis.

Update:  http://www.safehaven.com/article/21062/sp500-cycle-update

Thursday, May 19, 2011

MU 05-20-2011

MU appears to have just set a 22TD cycle bottom.  Based on the amplitude (DPO) of the 22TD cycle the upside target 2 weeks out is around $11.50 (a substantial % gain).  MU is a  volatile stock and should make an excellent trading stock.

Here is the visual:

GL Shadow (I am sure you already did your analysis).  Others, please do you analysis before risking your $s.

comments and outlook for 05-19-2011

Today was up as expected.  I thought we might see a bit more upside, but still it was within expectations.  We meed a couple of more days to say definitely we entered a new 22TD  cycle up leg, but it appears that way at this time.  The 22TD cycle is up, the 11.2TD cycle is up, the 5.6TD cycle is up.  The 2.8TD cycle is down to begin the day and should bottom by mid day and turn up.

So I would expect maybe some weakness early in the day from the 2.8TD cycle and a fairly strong finish for the week.   Maybe 5 points up on the S&P?

Here is a visual:

GL traders.  Do your own analysis.

Wednesday, May 18, 2011

ECRI - global slowdown by summer

The world is headed for an economic slowdown, according to the Economic Cycle Research Institute's (ECRI) Long Leading Index of global industrial growth.

Who would have thought it?

comments and outlook for 05-19-2011

What can I say?  My expectations for today were completely off base.  Of course I have to sheepishly admit I did tell you in my outlook for the week the following:  "My expectations for the coming week is that the 22TD cycle (and other shorter cycles will bottom mid week - as early as Tue close, but more likely sometime Wed)."    I believe that is what happened - the market bottomed Tuesday.  I have stated in the past that turning points can be tricky to call exactly.

So, it is my opinion now we saw a low yesterday.  I could try and make the argument that today was an aberration, but that would be ignoring the evidence.  If I have learned one thing over the years - don't argue with the data in front of you - you will lose the argument.  Besides I am trying to interpret the data not dictate market movement.

Fortunately, I had anticipated this and had a chart all prepared (just had to plug in today's data):

I will try and expand the chart to better show some future dates and post it later.  GL traders.  Today was a perfect example of why you should consider using stops. Do your own analysis

Update 06:37 EDT  - It appears tomorrow should be up.  May get some pullback toward the end of the day.  Here is an expanded chart:

Tuesday, May 17, 2011

comments and outlook for 05-18-2011

Well, I got it partly right, but failed to account for the bounce in the afternoon.  We broke below 1320 (as I opined we would).  The shorter cycles showed more upside than I thought they would.

If you have studied Gann you know he based much of his cycle work on 360, 90 etc (circle segments).  He also like 1/8ths of 90.  So - 1/8th of 90 is 11.25 (11.2TD cycle) and 1/4 is 22.50 (22TD cycle - which per Gann is actually 22 1/2 days).  Considering this - as we approach the bottom  I have made minor adjustments to my cycle presentation take that 1/2 day into consideration.

So tomorrow we have the 22.5TD cycle down, the 11.25TD cycle down, the 5.65TD cycle down and the 2.8TD cycle topping.  I expect we may have a positive open and then drop.  I would not be surprised if we see 1315 or lower for the S&P 500 and under 1310 before we bottom.

Here is the SPY chart:


GL traders.  Do your own analysis and don't forget to use stops.

Monday, May 16, 2011

$OIX - oil and the look ahead 5-16-2011

It appears that oil should be in a correction mode until early to mid July with a downside  objective that equates to the low to mid $80s per barrel.  I recently reviewed $silver and $gold and they show  similar dates for their correction (before they make another run up?).  This is also consistent with my belief that the market (S&P 500 in particular) should correct into the Jul-Aug time frame.

If you recall I looked at several sectors in February and said we were going basically sideways because the different sectors were set to bottom at different times.  Now it seems that commods are all in sync.  I will try to look at other sectors over the next few days, but for now the evidence is accumulating indicating we get a sizable pullback into July.

Here is the chart for $OIX:

Gl traders.  Do you own analysis.   Did you notice - I added a new widget for chat?  Drop in and say hi.  I am usually there the first hour or so and last hour of the day.  I may also be there at other times

Update - 05-17 08:49 pm EDT  - a chart you might find interesting:  http://static.safehaven.com/authors/readtheticker/21029_large.png 

comments and outlook for 05-17-2011

I said "So with this cycle alignment I expect Monday to be down.  I will be surprised if we don't get a 1% (or more) down day on the S&P 500.".  OK - paint me surprised, we did not get 1% down today.  At least I was in the right church - even if in the wrong pew.

Tuesday the 22TD cycle is  down, the 11.2TD cycle is down,  the 5.6TD cycle is down.  The 2.8TD cycle is up.  So tomorrow should be similar to today, but the push down by the longer of the short cycles if anything should be stronger than today.  I believe we should break below 1320 on the S&P 500 tomorrow.

Here is the chart with the short term cycles:

Gl traders.  Do your own analysis - and as always use stops to protect yourself....

Saturday, May 14, 2011

comments and outlook for week of 05-16-2011

The week just finished was much as projected.  My expectations for the coming week is that the 22TD cycle (and other shorter cycles will bottom mid week - as early as Tue close, but more likely sometime Wed).  So I expect a hard push down Mon and Tue to a low.  I have a target of the 1300-1310 as a low.

Take a look:

Taking a longer view, you need to be very aware we are in a period of time that could be a pivot for a substantial pullback.  The 20 week (Wall cycle) should top the week of May 21.  Also we are at a point where the down leg of the 1 year cycle should start having dominant influence.  So any bounce off the bottom next week is apt to be muted and short lived.

I collected some Fibonacci ratios going back to the early 1980s to highlight the potential targets.  It is my opinion that we see a substantial pullback into July starting as soon as next week or the week of 05-23.  Looking at cycle amplitudes for the 1 year and 20 week (Wall) cycles I believe the downside target is around 1100 by sometime in July.    How does this mesh with the Fibonaccis?  Here is a table:


The Fibs downside target that best fits my projections is 1095.  If I am wrong and the market continues up the next target is around 1443.  Here is a weekly chart of the SnP 500 showing my projections:


As you can see my target area covers the FIB 1095 projection.  As always - do your own analysis.  I like the confirmation between the cycle amplitude and FIB projections.

Friday, May 13, 2011

comments and outlook for 05-16-2011

First -  I'd like to comment on the Blogger outage.  I worked with computers about 35 years.  Over that time I installed lots of changes for maintenance and new software releases.  You learn early on (if you expect to last) that your back off plan needs to be as comprehensive as your install plan.  One thing you can be sure of is that sooner or later you will have to back out maintenance or an upgrade.  It seems to me that this did not happen with Blogger maintenance and when there were problems the staff was flying by the seat of their pants trying to recover. 

This type of procedure is unacceptable!!!  Can you imagine a bank installing maintenance and not being able to process transactions for 2 days?  Or FedEx not being able to track packages because of a maintenance glitch?  I can sell them my "Attention to Detail" video lecture from a former manager.  Hehehehe.  I hope that this is a learning event for the Blogger technical support staff.  Enough of my soapbox lecture.

Today was much as expected.  Sorry I was unable to get it posted until midday today.  Now we never know what will happen over the weekend, but my analysis is news agnostic - so here goes.  Monday should be down.  How's that - no wave counts, no multiple options, no hedging of opinion.

The 22TD cycle is down and is at the point where its impact should start to dominate.  The 11.2TD cycle is also down which should support the 22TD cycles push down.  The 5.6TD cycle is topping during the day providing some (but not a lot) of upside impulse.  The 2.8TD cycle  is down.  So with this cycle alignment I expect Monday to be down.  I will be surprised if we don't get a 1% (or more) down day on the S&P 500.

I mentioned several days the possibility of an "M" pattern forming, here is a visual of the SPY and the cycles take a look:


GL traders.  Do your own analysis - I could be wrong.

comments and 05-13-2011

As I am sure you noticed Google Blogger has been in "read only" mode - which means no new posts.  Actually it appears they have lost a day's worth of posts.

Yesterday was much as expected.    Today is also following script.  It does appear though the longer 22TD cycle is starting to dominate.  Thought we might see some green earlier in the day, but any green was fleeting and minor.

Here is the SPY chart:

GL traders.

Wednesday, May 11, 2011

$gold comments and outlook 05-12

Yesterday we looked at $silver.  Tonite I am featuring $gold.  As best as I can determine gold should bottom mid-June, then bounce and set a lower bottom by the end of August.

Here are charts:


Gl traders, you like gold - be patient.

Comments and 05-12-2011

Today was as expected in yesterday's post.  The day was down with a small bounce toward the close.  Tomorrow is less clear.  I believe we may get a small down tick early and then turn up for the remainder of the day.  The 22TD cycle is down, the  11.2TD cycle topped and turned down.  The 5.6TD and 2.8TD cycles turn up early in the day (if not before the close).  So that gives us the two longer cycles down, the two shorter cycles up.  I expected the shorter cycles to win as they turn quicker and that we will have an up day.  I do not believe it will be a big up day, but up 5 or so points.

Of course the risk/question is when does the 22TD cycle gain enough momentum to dominate?  We should be approaching that point (so there is a good chance we do not get the expected up move).

Here is the chart:


GL traders.  Do your own analysis.

Tuesday, May 10, 2011

$silver the outlook 5-11-2011

One would expect it will take some time for silver to work thru the current volatility and reestablish a trend.  The charts indicate that will be around the end of June - first of July.  The projected bottom is  $32.50-$35.00 (of course we have already seen sub $35).   So I suspect we will base for the next 10-12 weeks in the $30s before silver begins another leg up.

Here is a chart:

GL, do your own analysis....

comments and outlook 05-11-2011

Oops, missed the action today.  Reviewed my chart and it appears I inadvertently slipped the bottoms I was looking at about 1/2 a day left.   I need better tools than manually drawing the cycles, but tools cost money for the software and input data.....  So I suppose you will have to tolerate my occasional slip up.

Tomorrow we have the 22TD cycle down, the 11.2TD cycle up, the 5.6TD cycle down and the 2.8TD cycle down.  So it appears the day I was looking for today (due to my slip up) happens tomorrow.

Here is the chart:


GL traders, do your own analysis

Monday, May 9, 2011

comments and outlook for 05-10

Today played out much as I expected in my post.  Tomorrow I expect a down day.  The 22TD cycle is down.  the 5.6TD cycle is down the next day and a half.  The 2.8 day cycle should top in the morning and turn down,  the 11.2 day cycle is up.  With this setup I expect the market to be down for the day tomorrow and into the day Wednesday.  We probably give up today's gains and then some.

Here is a visual:
GL traders.  Do your own analysis.
Update:  CME increases margins on oil futures by 25%.

Sunday, May 8, 2011

comments and outlook for 05-09-2011

Friday showed some recovery from a down week as I expected.  Monday should continue that recovery, but it will slow and not very exciting.  I would expect a minor move up early, a pullback midday and then a modest move up in the afternoon.  The 22TD cycle is down but not at full momentum down yet.  The 11.2TD cycle is up, the 5.6TD cycle is up but tops around noon. the 2.8TD cycle is down and bottoms around noon.  Maybe 4-5 points on the S&P at the end of the day?

Here is a visual:

GL traders.  Do your own analysis..


Friday, May 6, 2011

comments and the week ahead 05-09-2011

This past week played out much as expected as it topped and turned down. I had stated I expected at least a 20 point pullback (we got more).  A lower low Thursday was a bit of a surprise, still by the end of the week the market had stated to recover as the short cycles turned up. 

Next week the 11TD cycle will be up most of the week.  This cycle has about 31 points of amplitude so it should result in an up week.  Of course the 22TD cycle has turned down, so the upside potential is less than 31 points (I would estimate 20-25 points).  I expect we should see 1360ish on the S&P during the week, but I doubt we test recent highs.  Since the shorter cycles will be up/down during the week I do not expect a lot of overall contribution (or subtraction) for the week even though they may have 1-2 day impacts during the week.  By the end of the week the 11TD cycle should top. Setting up the next week of 5-16 (more on this later).

Here is a visual:

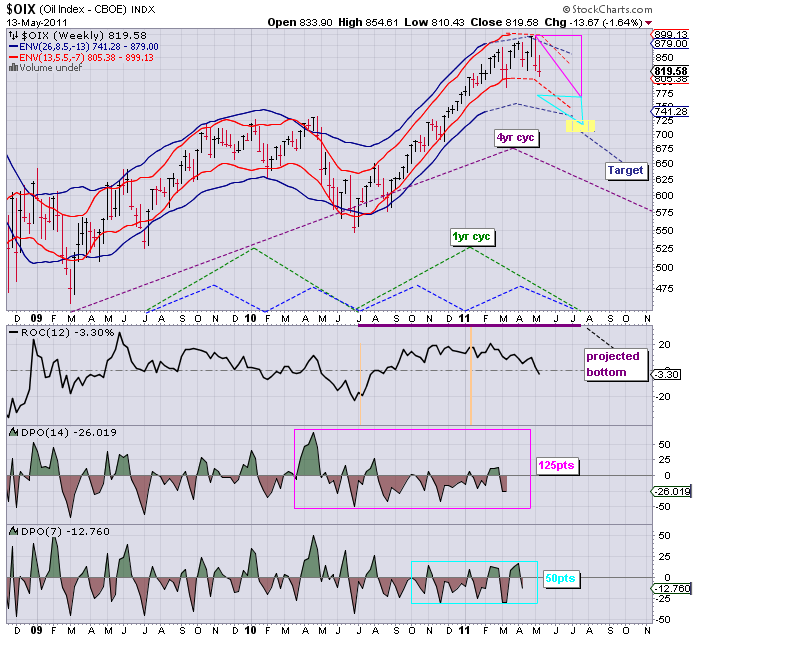
As I stated the 11TD cycle should top by the end of next week.  That means the week of 05-16 we have the 11TD cycle and the 22TD cycle down.  So that means the week of May 16 should be down, but just as the 22 day cycle bottoms we have a Wall cycle (20 weeks) topping and it will be down into the first week of July.  But, more important in my opinion we have the one year cycle reaching the point in its down leg (Jan-Jul) where it should start dominating to the downside.  So I believe by mid-May we will have a setup for a 6 week or so pullback in the market.  If you have gotten complacent - WAKE UP - things are reaching a critical point of change.

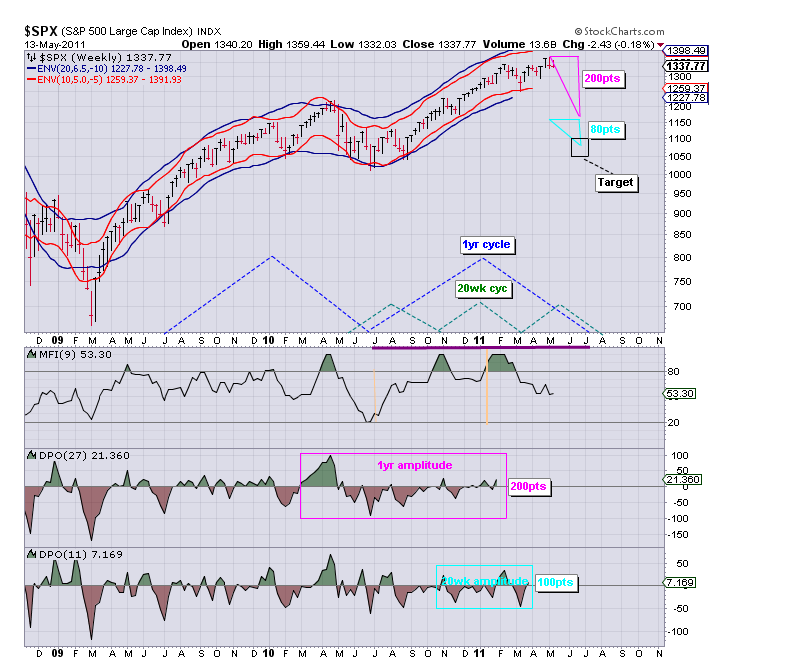
How big a change.  Here is a visual showing the potential amplitude of the 1 year and 20 wk Wall cycle into the first week of July when both should bottom:


As you can see the potential downside is considerable (around 280 points down on the S&P).  So this is a correction to avoid!!! or play to the short side.  And that traders is the story behind sell in May and go away

No this is not the big one, that starts later in the year (Oct-Nov) as the 2 year cycle and Kitchin cycle reach the point of maximum downside movement.  Of course there is the 10 year, 30 year, 60 year, 120 year cycle bottoms to follow that, but we will have time to address those at a later date.

GL traders.  Do your own analysis

Thursday, May 5, 2011

comments and outlook for 05-06-2011

Today didn't turn out exactly as expected!!!  Looked like we might actually turn green by the end of the day up to about 2:30pm then the overall market fell apart.  So I took a little pain, but overall not too bad.  Got into HL at a decent entry and was down on that by around 6 cents a share at the close.  Had some inverse which helped.  Had some PBR which hurt.   So, overall I lost some, but not a lot.

Let's see what tomorrow brings.  Was this a one day event or the start of something?  You have probably heard the old saw "sell in May and go away".  There is a reason for that.  The 1 year cycle bottoms early July, but it really doesn't get hard down (usually) until mid-May.  And as you know if you have looked at my longer term cycles there are a couple of other longer cycles down.  Still, I don't expect the real damage from these cycles to  kick in  for a couple of weeks.  I will be watching this situation closely.

So tomorrow looks like the 22TD cycle starts to build a bit of downside momentum.  The 11.2TD cycle and 5.6TD cycle remain up.  The 2.8TD cycle should have topped near the end of the day and turned down.  May be a bit of a coin toss tomorrow.   I believe though the odds slightly favor an up day.

Here is a visual:

GL traders.  Do your own analysis and be careful, tomorrow may be tricky

Wednesday, May 4, 2011

comments and outlook 05-05-2011

Today was almost exactly as I projected.  Bottoms should have occurred for the 3 shorter cycles (11.2TD, 5.6TD and 2.8TD cycles) as the 22TD cycle has now turned down.  Since the shorter cycles turn quicker and happen over shorter periods the bias should now have turned up.  I do not expect a large up day tomorrow, but we could recover half of today's loss, so I do expect tomorrow to be biased to the upside and a green day.

Here is a visual:
GL traders.  Do your own analysis, today I bought the dip to establish a couple of positions.

Tuesday, May 3, 2011

PBR - a look at an oil company 05-04-2011

PBR appears to have put in a bottom and is at a point it should be considered for buying.  Here is a visual:

GL, traders.  Do your own analysis before deciding.  

update HL 05-04-2011

We last looked at HL on 04-11:  http://swingcycles.blogspot.com/2011/04/hl-and-mmr-update-04-11.html
and we said it should bottom around the first of May.  HL went mainly sideways with a slight down bias during this time.  IMO it is now putting in the expected bottom (may have done that today).

Here is a visual:

GL traders.  Do not buy before doing your own analysis.

comments and outlook for 05-04-2011

Today played out much as expected...  Tomorrow may well be the most interesting day of the week as there are 3 short cycles bottoming during the day.  So it should be no surprise if we are down hard the first half of the day, but maybe some bounce back by the end of the day.  Still the day should be down at the end of the day.  The 22 day cycle should have (or will top tomorrow) topped.

Here is a visual:
GL traders.  Do your own analysis, line up your buys.

Monday, May 2, 2011

comments and outlook for 05-03-2011

Given the weekend news one may have expected more enthusiasm.  Got a little upside (as I said we might) early and then drifted (as I suggested we would).  In spite of the news the market behaved as expected from my read of the cycles.  This is what we would expect as the 22TD cycle tops. 

Tomorrow I expect we might again get some up push at the open.  I do not think we will test today's highs and that the rest of the day will show some weakness.  The 3 shorter cycles are down (11.2TD, 5.6TD, 2.8TD) are down.  The 22 TD cycle is topping and should tum down by Wednesday.  There is a short one day cycle that may give us a minor positive open.  We should get a hard down starting by midday that should last in to Wednesday.

Here is a visual:

GL traders.  Do your own analysis.

Sunday, May 1, 2011

Comments and the week ahead 05-02-2011

The 22TD cycles should top Monday or Tuesday.  Then the shorter cycles align Tuesday for a hard down Wednesday (could start sometime Tuesday),  I would not be surprised to see a 20 point pullback on the S&P between mid-day Tuesday and mid-day Thursday.  I believe though we see some recovery the last part of the week.

So it should be a volatile week.  I believe the bias is for a down week.  With a recovery starting by the end of the week into the middle of the following week which may test Friday's highs.  I do not see this as the start of the long awaited correction.  That will not start before mid-May at the earliest IMO, and possibly not until June.  So a "V" shape (maybe a square root) type of pattern forms?

Here is a visual:

Gl Traders, do your own analysis.  Read a couple of blogs and there seems to be expectations substantial in the way of a correction.  I believe these predictions are early.

Spiral dates calendar for May 2011

May 2011 shows three strong peaks on the 2nd coinciding with the new moon, on the 6th and on the 18th a day after the full moon. Whether the first two peaks will match separate turns or if they will both apply to a single broader turn is an obvious question. My guess given the sideways movement since the Feb 18th high is they will mark a high of a corrective wave B of 4 of the rally since last August. This implies a moderate decline in wave C or rangebound sideways movement for a month or two, then a move up to a modest new high in late summer or fall that would be expected to be the top.

http://spiraldates.com/2011/charts/scores_0511.png

comments and outlook for 05-02-2011

The market appears to be slowing down in its upside push.  Yeah, Friday  closed green, but given the huge beat by CAT it is surprising that the DOW did now roar to the upside,  Good news seems to be having less of an impact.  This is the type of action one expects as a cycle top approaches,

The 22TD cycle may top on Monday (but more likely that will happen on Tuesday).  The cycles are mixed - some up and some down.  The 22TD as mentioned is still up but will top soon. The 11.2TD cycle and the 5.6TD cycle are down.  The 2.8TD cycle is down.   So there is about a 50-50 chance of closing green (same for red).  I expect a rather slow day with a limited range on Monday.  My guess would be some upside early fading toward the end of the day.

Here is a visual:

GL traders, do your own analysis.