Monday, February 28, 2011

OIL watch update 03-01

I sold my position in the OIL etf last week at $26.70.  Tried to reenter later , but got stopped out with a small loss.  So I am sitting on the sidelines watching.  We all are aware of the events in the Mid East that could affect the price of oil.  If things quiet down oil could fall.  It things heat up oil could rise.  I have no idea how to predict these things.

So, I fall back on TA and what it projects.  There is a huge gap that is unfilled.  OIL seems to want to pullback.  Projections indicate we should have set a top (sell signals from CCI and channel envelopes).  Based on the cycles it looks like OIL should pull back the next 8-10 days into mid-Mar.  So I will be watching for a new/better entry point for OIL. 

Here is a current chart:
GL traders.  Do your own analysis.

Comments and outlook for 03-01

Well, it was another day of "guess the open".  We popped at the open (not in my projection), drifted down (which was my projection) and closed with a move up.  I guess you could say the bias for most of the day was down (except the open and close).  So partially right, but not a great call.

My "guess the open" for tomorrow - is open higher.  The bias for the day should be up and we probably break above 1330 on S&P and close near the day's high.


GL traders.  Do your own analysis.

Sunday, February 27, 2011

The long and short of it - outlook for 2-28

We have looked at the relationship of cycles as long as the KWave (about 60 years) to as short as about 11 days.  We have explained how each cycle is a factor of a longer cycle (or a longer cycle is a multiple of a shorter cycle.  Now we have not covered all the possible cycles (IE 1 year cycle), but I am sure most could be related to those cycles we have covered as a factor or multiple of a cycle we have covered.  I leave that to you if you desire to pursue it.

But, what about the cycles less than 11 days?  The 11 day cycle is probably 11.22-11.50 days in length.  So half of that is 5.5+ days.  And half of 5.5+ days is 2.75+ days.  Do such cycles exist.  See for yourself:

You will observe we have the 11+ day cycle down through Monday. The 5+  and 2.75+ day cycles are also down Monday.  This implies Monday should have a down bias, but Tue/Wed and maybe Thur should not.

GL traders.  Do your own analysis - the above is the opinion of the author and the author may have misinterpreted the placement of 1 or more cycles..

The week ahead 02-28

Looking at the near term we see that we received short term buy signals late last week for the CCI and the envelope channels.  I expect that signal is good for the next 3 or so trading days until the 11 day cycle tops.  The we will have the 11 day and 34 day cycles down thru the remainder of the week. 

So if you have a short term swing trade on watch the market closely for a turn before Thursday (and tighten your stops by mid-week).  Overall we should see upside bias (target under 1230 - see chart) first part of the week and then a reversal last couple of days of the week.  Mid-week may present an opportunity to buy an inverse ETF?

Here is a chart:

GL traders, proceed with care and do your own analysis. 

The month ahead (March) 2-28

I have provided you a comprehensive long term outlook.  Of course this gives you the expected overall environment over the next couple of years, but does nothing when it comes to shorter time frames for swing cycle trading.  So Here is the outlook for the coming month.

Summary:
  • The Wall cycle (20 weeks) should be down
  • The 1 year cycle should be down
  • The Kitchin cycle (41 months) should be down
These are the primary cycles that should drive the market over the next few weeks (month).  So it would seem we should expect a down bias in March.  The envelope (lower channel) target is around 1250.  Of course if we get a hard sell off this may be optimistic.  On the other hand with the FED pumping (POMO) liquidity into the economy/market this could be too pessimistic.  Still, I believe the bias for the month is down.

Here is a chart looking at the near future (next month or so):
GL traders.  Do your own analysis.  Use stops to preserve your gains.

The long cycles

I mentioned the Juglar cycle in my last post.  It is supposedly 7-11 years.  I find that much variance to be too large to be helpful, so I am not including it.  As an economic cycle I will (for the time being) assume the 10 year cycle is the resulting cycle in the stock market.

The 10 year cycle may actually be 10-10.5 years (120-126 months).  My reasoning is that it is 3 Kitchin cycles in length.   Most people refer to the Kitchin Cycle as 41 or 42 months.  One authority claims it is 40.68 months. that is about  122 months or 10 years and 2 months. If the Kitchin cycle  is 42 months then 3 cycles is 10 years 6 months (126 months or 10.5 years).

Each Kitchin cycle is composed of 9 Wall cycles of 20 weeks.  An average month is 30.42 days (365 / 12).  So a Kitchin cycle is  1237. 5 days (40.68 X 30.42) to  1277.6 days (42 X  30.42).  A Wall cycle is 140 days (20 X 7). That means 9 wall cycles is  1260 days.  We have 1237.5 days (Kitchin cycle of 40.68 months), 1260 days (9 Wall cycles), 1277.6 days (Kitchin cycle of 42 months). 

So lets go with 41 months for the length of a Kitchin cycle (1247 days).  If there is 3 Kitchin cycles in our 10+ year cycle that is 3744 days (3 X 1247 + 2 leap days).  Since 10 years is 120 months which is   3652.4 days (120 x 30.42 + 2 leap days).  That  is 92 days (3 months) less than 3744 days.  So that makes the 10+ year cycle 10 years and 3 months long. 

Let's review: 
  • The Wall cycle is 20 weeks. There are 9 Wall cycles in Kitchin cycle.
  • The Kitchin cycle is 41 months long.  There are 3 Kitchin cycles in the 10+ year cycle.  This 10+ year cycle may be the Juglar cycle?
  • The 10+ year cycle is 10 years and 3 months long.
  • Three 10+ year cycles  30.75 years or equal a Supercycle.
  • Six 10+ year cycles is 61.5 years or a KWave
Note:  A Supercycle is 2 Kuznets cycles  in length - so a Kuznets cycle is about 15.37 years (or 1.5 time the 10+ year cycle.)

We see from this each cycle is a multiple of a shorter cycle.  With this in mind  I redid the chart for the very long cycles and updated my prior post.   Here is my latest attempt to chart the 10+ year, Kitchin and and Wall cycles (as they fit into the context of the longer cycles):


Traders enjoy.  Please do your own analysis.  Later we may look at even shorter cycles and see if they are factors of the Wall cycle.

Saturday, February 26, 2011

The really long cycles

The K-Wave (half a Kondratiev cycle)
The Russian economist Nikolai Kondratiev (also written Kondratieff) was the first to bring these observations to international attention in his book The Major Economic Cycles (1925) alongside other works written in the same decade. Two Dutch economists, Jacob van Gelderen and Samuel de Wolff, had previously argued for the existence of 50 to 60 year cycles in 1913. However, the work of de Wolff and van Gelderen has only recently been translated from Dutch to reach a wider audience.

More recently, some argue that government intervention into the economy to try and control economic cycles has lengthened the cycle to around 64 years. Most refer to this as a K-Wave.

The Super cycle
Others such as Elliott have speculated there are longer cycles (Grand Supercycle). Also, supposedly within a Grand Supercycle there are shorter (yet long) cycles known as Supercycles. How does a Supercycle fit within the context of a K-Wave? Well, some claim within a K-Wave there are two Supercycles (each half the length of a K-Wave).


And then there is Kuznets
Simon Kuznets (Nobel Prize winner) studied demographics and from his studies found cyclic trends. Kuznets swing is a claimed medium-range economic wave with a period of 15-25 years found in 1930 by Simon Kuznets.[1] Kuznets connected these waves with demographic processes, in particular with immigrant inflows/outflows and the changes in construction intensity that they caused, that is why he denoted them as "demographic" or "building" cycles/swings. Kuznets swings have been also interpreted as infrastructural investment cycles.

So a Kuznets cycle is half a Supercycle. So a K-wave is 2 Supercycles or 4 Kuznets cycles...

The Fork in the road

We have talked about the Kitchin cycles and Wall cycles in the past. But a gentleman last name Juglar claims there is a 8-11 year cycle and like stars they named it after him (the Juglar cycle). Many have related this to the Kuznet Cycle (half a Kuznets cycle) and the Kitchin Cycle (2 Kitchin cycles). This implies 8 Juglar cycle within a K-wave and 16 Kitchin cycles in a K-Wave.

If a K-Wave is 64 years that is 768 months. A Kitchin cycle is 42 months +/-. We did the math and find a 64 year K_Wave is 18 Kitchin cycles.... So we are not happy with the Kitchin/Juglar relationship.

We have told you about the 10 year cycle (and how it is approximately 3 Kitchin cycles). We do the math and a K-Wave is 6.4 ten year cycles (or 6 x 10.57 years). Three Kitchin Cycles of 42 months (3.5 years) is 10.5 years.  I believe this relationship works better than the Juglar/Kitchin relationship.

There is some dispute as to whether there are 16 or 18 Kitchin cycles within a K-Wave. I tend to believe there are 18 (6 X 10+ year cycles or 3 X 6 Kitchin cycles).

And as always here is a visual (K_wave, Supercycle, Kuznets  - updated 02-27):


Enjoy the big picture. 

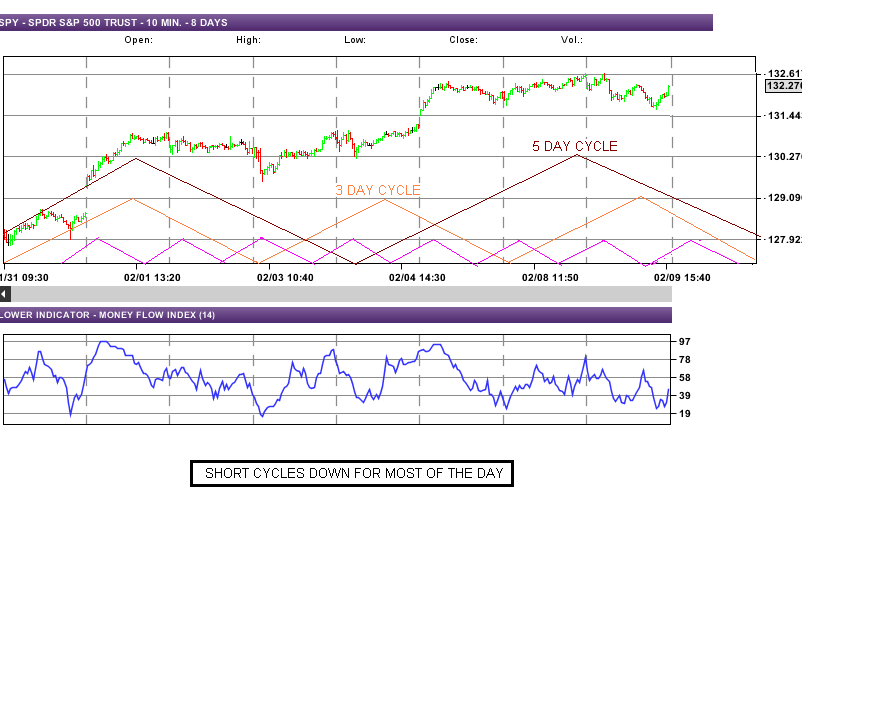
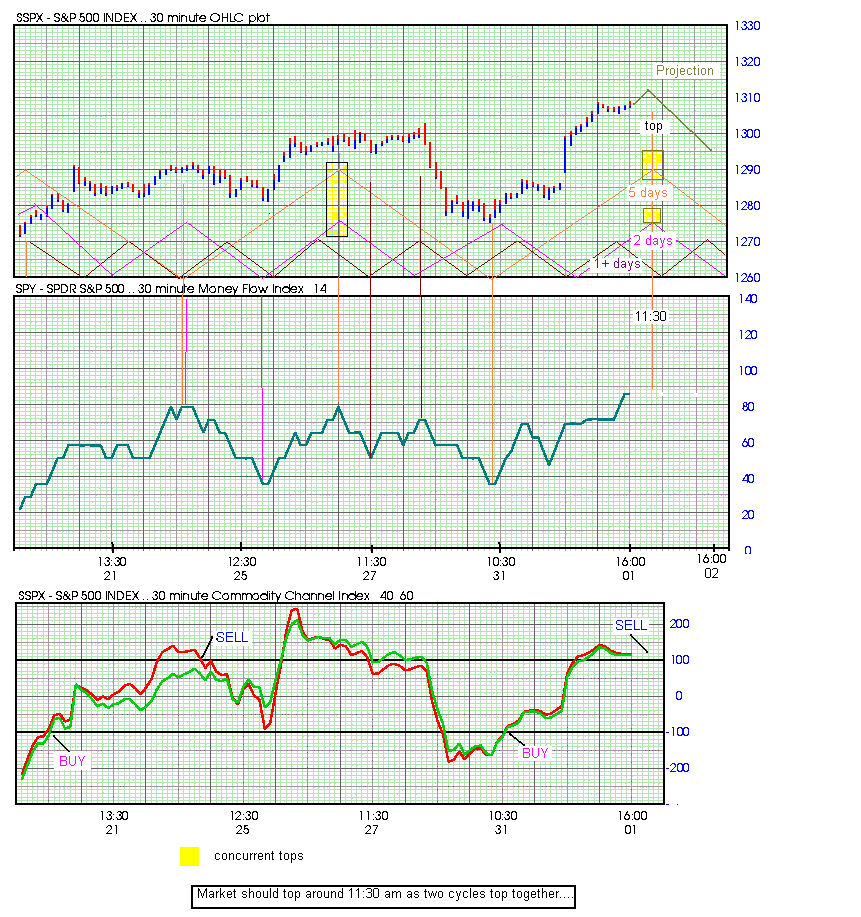
Later we will try to tie in the shorter cycles we discussed.

Thursday, February 24, 2011

Comments and outlook 2-25

I mentioned yesterday we should not be surprised if we get an up day today or tomorrow.  I guess I failed to mentioned we could get a mixed day (some indices up, some down) - which is what we saw today.  I guess you could say I was half right.

So we had the 7+ day cycle bottom and turn  up (see yesterday's chart).  Tomorrow we should see the 11 day cycle top and turn down (again - see yesterday's chart).  So these two cycles should be a push (offset each other).

It still appears that the longer cycles are providing some downward momentum.  So how does this play out with the 5 day, 4 day and 1 day cycles. The 5 day cycle is up, the 4 day cycle is down - so another push (offsetting cycles).  The 1 day cycle tops around 10:30-11:00 am and is down until around 2:00 pm.  So maybe a little upward movement early and weakness during the middle of the session and some recovery into the close.

The day overall should have a down bias from the longer cycles and IMO close red.  For your viewing pleasure:

GL traders, do your own analysis and use extreme caution in buying dips.

Wednesday, February 23, 2011

comments amd outlook for 2-24

If you follow my posts regularly you know I turned bearish about 2 weeks ago.  Now I was early, but I wanted to be sure I provided ample time  for people to make adjustments (tighten stops, trim positions).  We got some follow through  today on yesterday's substantial sell off.  So this is developing the feel of something more than a 1-2 day correction.  Time will tell.  What we can be sure of is the market supporters (IE the Bernank) won't give up without a fight.  So this is apt to be 2-3 days down and 1 day up over the next 4-8 weeks.  It may be totally frustrating at times.  But, recognize it for what it is and don't be too quick to buy dips and when you buy look at areas that can benefit  (IE energy related ETFS) from the environment.

Tonite I will not focus on the  very short cycles as they lack the amplitude to overcome the general trend IMO.  But we will look at the short cycles.  We have one bottoming and one that will top and turn down (probably Friday).  Here is a chart:


Gl traders.  IMO the bias is now down, but we should not be surprised if tomorrow or Friday is up.  Do your own analysis please.

Tuesday, February 22, 2011

comments and 02-23 outlook

Given the extent of the selling today something of a bounce tomorrow would not be surprising. There are indicators (IE TRIN) that suggest we are not oversold yet though.   If we have an actual change in trend though you probably want to exercise extreme care betting against the trend (going long).

The short cycles may show up, but if as I expect the longer cycles have kicked in to the downside then any effect will be fleeting.  And the short cycles do suggest the possibility of a bounce tomorrow.  See for yourself:

Gl traders.  Tread carefully and do your own analysis.

Cycles or Elliott Waves?

It is not an either/or question.  Elliott Waves can be explained in terms of cycles.  Cycles is the basis for Elliott Waves.  Source:  http://www.financialsensearchive.com/editorials/bronson/Model.pdf  If you are a student cycles read the article - loads of information....

Borrowed from this source:

Knowledge is power.

Monday, February 21, 2011

The week of 02-21

Took a look at the futures as the market was closed today.  With all that was going on in the ME (Libya a major oil producer in particular) the futures were red and oil up as one would expect.  Is this the catalyst to reverse the market for the time being?  Maybe we find out on Tuesday (the European markets were down today).  Interesting that CNBC had people in reporting on the ME situation all morning.  Don't worry about Libya - the Saudis have plenty of capacity to make that up (or so seems to be the party line).

As I have indicated the past couple of weeks I believe we should be at a point where we get a trend reversal.  It may only be for 4-8 weeks, but to go much higher the market needs a correction to reset expectations.  Everyone is on edge waiting for that correction and unwilling to commit more on the long side until that happens.  So in that respect a correction is viewed as a positive by the bullish.

The cycles keep topping so sooner or later we get that correction:
  • The 10 year cycle is down  (Juglar cycle - 3x the Kitchin cycle)
  • the Kitchin cycle (41 months) is down
  • the 2 year (24 month cycle) is up
  • The one year cycle is down
  • The 7 month cycle (just topped)
  • the 20 week  (Wall) cycle is down
  • the 22 day cycle is down
  • the 11 day cycle is down 2 more days
So what is keeping the market up?  The FED may interrupt the natural flow of the cycles on a temporary basis, but don't fool Mother Nature - it ain't nice.  So with all that is going on in the ME we have the perfect excuse for a cyclic downturn.

Here are the charts:


GL traders.  Do your own analysis.

Sunday, February 20, 2011

sector analysis (cont)

I took the 12 sectors I did projections for and plotted them on a timeline.  This more clearly shows what should lie ahead.  We have a cluster of sectors expected to bottom in Mar/Apr.  This should be the first leg of any correction.  By May these sectors will have turned up.  We have 2-3 influential sectors bottoming in May though so this may create some volatility.  By the end of June (early July) we have many of these sectors topping again.  So we could get a second leg of correction in Jul-Sep.  Time will tell.

Here is the timeline I construction for the 12 sectors I examined:
There is no guarantee the market will work out a projected.  Still - I have tried to provide you a possible trajectory over time.

GL traders.  Do your own analysis.
 

Sector analysis

Cycles keep topping (or so it seems) as they hit the time lines where tops should occur.  Yet, the market keeps advancing.  So what is going on?  Cycles seem to work reasonably well for individual issues, but not for the indexes.

With this in mind I decided to look at sectors.  Could this give us a clue as to what is happening underneath.  What appears to be happening is that we have a strength moving from one sector to another and this is pulling the market higher.  At some point his process should reverse.  For example in December retail and financials seemed to be leading the market.  Now it appears commodities, manufacturing, technology has taken the lead (with financials and retail lagging).   So we have a rolling advance.

I did forward projections on 12 sectors.  I appears some of the leading sectors are overdue a correction.  If my projections are right then it appears we should have a cluster of sectors bottoming in Mar/Apr. 

Here are the 12 sectors I did projections for:

If you examine these projections you will see that they are not projected all to bottom together over the next 4-5 months.  So just as we have had a rolling rally it appears chances are good we will not have a sudden and deep correction, but a rolling correction over the next 4-5 months.

Gl traders.  Do your own analysis.

Thursday, February 17, 2011

Comments and 02-18 outlook

Again it came down to a "guess the open" type day.  We opened down and then saw the expected move up.  The afternoon and close a little stronger than expected.  Still not a bad call for the day.

Tomorrow we should have the 5 day, 8 day and 11 day cycles up and topping by Tue next week  The shorter cycles are down most of the day.   Expect these 3 longer cycles to set the aura for the day and the market to move up most of the day.  May get a push into the close as 2 of the 3 short cycles will have bottomed during the day.

Here are charts:


GL traders.  Do your own analysis and keep those stops in place to protect profits.

Wednesday, February 16, 2011

comments and 02-17 outlook

The Game seems to be "guess the open".  Seems the past few weeks if you could guess the open you called the market for the day.  I suppose it is cheaper to control the market with off hour futures (if there is any funny stuff going on).    Happened today...  Again....  Other than the first hour my call was not bad for today.

Tomorrow it appears we have a majority of the short cycles up for at least the first half of the day.  If the premarket futures cooperate the bias should be up for the first part of the day.  By midday a couple of cycles turn down.  So it should start to the upside and falter midday and go sideways (maybe some down bias).

Here is the chart:

GL traders.  Do your own analysis and keep stops in place.

Tuesday, February 15, 2011

Comments and outlook for 02-16

Some red on the tape today - all 3 indexes.  We speculated with short cycles down this may happen.  Unsure if this is just a short term "blip" down or the start of something bigger.  Use care and keep your stops in place.

Tomorrow we start off with the short cycles down so we may get some continuation.  By afternoon the 2 shortest cycles turn up.  So we should see a down bias first half of the day and sideways the second half of the day based on the shorter cycles.  Of course, if today was the start of a bigger correction the entire day could be downward biased.


Here is the shorter cycles:

Gl traders.  Do your own analysis....

New articles on cycles

http://www.safehaven.com/article/19990/crisis-high-2011

http://www.safehaven.com/article/19979/tracking-individual-stock-cycles-in-price-and-time

Enjoy.

Nenner on bonds 02-11

"Now, in an interview with Business Spectator, he warns that US bonds have now entered a bear market.
Although Nenner says we might see small bounce in bond prices from this point, the low point for bond yields has already passed. (Bond prices move inversely to yields.)."


http://www.businessspectator.com.au/bs.nsf/Article/bonds-interest-rates-Australia-dollar-economy-pd20110211-DY4B9?opendocument&src=rss

See my latest comments on TLT: http://swingcycles.blogspot.com/2011/02/gold-silver-bonds-ags-watch-2-13.html

Comments and outlook 02-15

Longer cycles keep topping and the market keeps going up.  Hard to explain.  The most logical theory I hear is the FED with QE2 is pumping in liquidity with POMO and this supports up cycles and acts to dampen down cycles.  Now I don't claim to be smart enough to know if this is true and if true to what extent it affects the cycles.  It is true there are unexpected events that can affect the market (IE 9-11 caused a big spike down) and that cycles do not account for 100% of market movement.  Something like 25% or more of market movement is probably due to news and other factors.

If QE2 is the cause of cycles being supported to the upside and suppressed to the downside this is not natural and sooner or later nature will win out.  So we have this huge spring being wound tighter and tighter and the response will be substantial when the pressure is removed as nature takes its course.

as to the near term it appears that the short term cycles should be down most of the day.  As to what impact this will have I assume it will provide some downside bias.  Here is the short cycles:

Gl traders.  Don't forget to keep your stops in place to preserve gains.

Saturday, February 12, 2011

Gold, silver, bonds, ags watch 2-13

  • Gold (PHYS) topped late Nov and should bottom mid April.
  • Silver (PSLV) bottomed around Christmas,  should top around Mar 11, bottom again Apr 29.
  • Bonds (TLT) bottomed early Dec and should top around Mar 25, then bottom late June
  • Ag commodities (RJA) should pull back some by first week of March, then next high is early May

Here is charts:
GL traders.  Do your own analysis - this information is only meant to give you dates to watch (not act).  Trade the market you see not some prediction.

The week ahead 02-13

Last week did not work out as predicted.  If we get a correction - I was early.  To be honest I had rather be early than late  (bad habit - always early for appointments too).  Based on the current alignment of cycles we are due (some may claim over due) a correction. 

If you looked at my prior post you will see:
  • The 10 year cycle is down
  • The 41 month (Kitchin) cycle is down
  • The 2 year cycle is up until early October
Now I believe:
  • The 1 year cycle topped in January and is down into early/mid July
  • the 20 week cycle topped and is now down
  • The Wall cycle is up thru the end of February
  • the 45td cycle is ready to top

Here is the chart:

Considering the alignment of cycles it seems that I was early going out on a limb last week, but that a correction could well start this week.

GL traders.  Do your own analysis. I may add shorter cycles later.....

Does history repeat in the market? 2-11 (cont2)

Now I know some people look for similar chart formations (I believe they refer to them as fractals) to try and predict future stock action.  What is their rational in selecting date ranges?   If you are going to compare patterns then I believe you need a reason for selecting the the date ranges to compare.  I believe as good a reason as any is a similar alignment of dominant cycles.

In 2002 from Jul-Oct you had 3 dominant cycles bottoming.  They were the 10year cycle, the 41 month (Kitchin) cycle and the 2 year cycle.  Now the 10 year cycle should bottom again around Oct 2012.  Since the 10 year cycle is 120 months it is approximately three 41 month (Kitchin) cycles. Finally a 10 year cycle is the length of five 2 year cycles.  So based on rational one might expect 2000-2002 to look like 2010-2012.

And all things being equal that comparsion may have worked.  But on 9-11-2001 there was a non-cycle event that caused a sharp spike down which we cannot expect will be repeated this year. If we make allowances for that though we can make a stab at predicting how the next 20 months or so will look.

With this in mind I constructed a possible scenario for 2011- 2012 (thru Oct).  Here is that scenario (based on similar cycle alignment in 2001-2002 and 2011-2012:


This is for entertainment purposes only and should not be a basis for investment.  Only time will tell if it is even close to reality. It does illustrate though how the study of cycles can assist you in setting expectations and where the pitfalls may lie.     

Friday, February 11, 2011

Does history repeat in the market? 2-11 (cont)

I showed you 2 charts that look remarkably similar.  So does history repeat or just rhyme?  Well one chart covers about 2 years, the other about 4 years.  The first chart was 2001-2002 time frame.  The second chart was 2007-2010 time frame.  So I think we can agree - not a repeat of history, but a rhyme. 

In other words the market is moving at a slower pace down/up than it was during the ".com" bust and recovery.  So keep that in mind when viewing the charts (if 2001-2002 chart makes a move in 1 month it would take 2 months to make the same move today  if that relationship continues).

So here are the charts with labels (time and price):

Hope you found this enlightening.  GL traders.

Thursday, February 10, 2011

Does history repeat in the market? 2-11

I contend that history never exactly repeats in the market, but there are times when it rhymes very well.  I have two undated  vanilla charts of the DJIA for you to view.  They are real charts - and they are amazingly similar.  No I didn't got back to the 1930s-90s either.  Look at them.  Which is a current chart?

Here they are:

Now in the case of one chart we know what came later.  In the case of the other we are waiting to find out.  Is that a clue as to what is to follow? I will post complete information later.  Post your guesses as a comment.

comments and outlook 02-11

My call for yesterday of weakness for most of the day was OK.  Looks like my call for the week though will miss the mark unless we get a strong down tomorrow.  Which is possible but does not appear to be a strong possibility.

I have shown the longer of the short term cycles (11 and 22 days) and  turned down now.  Tomorrow will tell us how soon they have an impact.  We have other cycles up in the am but turning down duting the day.  So I think there is the possibility of some selling in the afternoon.

Here are charts:

GL traders, do your own analysis and protect profits with stop orders.

Wednesday, February 9, 2011

comments and outlook for 02-10

What do you mean you don't like my EW chart/count?  I thought it was cool.  OK, enough fun with EW devotees.  Today we got a down day.  True, not a big down day, but the morning should have shown strength from the short cycles and didn't.  Maybe a clue of a change?

Tomorrow the short cycles are down from the open and mostly down all day.  So tomorrow could be the substantial down day we have been waiting on.  Time will tell.  Here is a 10 min chart of the SPY:

Gl traders.  Keep your stops tight and do your own analysis.

Tuesday, February 8, 2011

comments and outlook 02-09

I was asked about EW.  I don't really do EW, but here is my KISS (Keep It Simple Stupid) version of an EW chart:


As you can see per EW we near a critical point ( 2 X March 09 low) or a FIB of 1.00.  Which supports my cycle analysis that this week could well mark a turn and we could even end the week lower.

Looks like strength in the AM and fade in the PM.  Keep in mind if the longer cycles kick in you can forget what these short cycles indicate.  Here is a short term cycle chart:

GL traders.  Be sure to maintain stops and do your own analysis.  

Monday, February 7, 2011

outlook for 02-08

The short cycles are upward biased for tomorrow.  I am bearish for the week and expect the longer cycles to take control during the week.  If that happens tomorrow you can forget the short cycle bias.

Here is the SPY chart:

GL traders.   Do your own analysis.  If you have long positions protect yourself with stops.

Sunday, February 6, 2011

Slow Sto signals sell off ahead 2-7

According to Robert McHugh if the Slow Sto stays above 20 for 2.5 months a sell off normally occurs (+/- 2 weeks).  Here is the Slow STO:


The Slow STO has now been above 20 for 2.5 months (+/-). 

GL traders.  Do your own analysis

Saturday, February 5, 2011

Long term cycles environment 2-7

Our weekly outlook discusses the medium length cycles.  But what is the longer term environment?  The 41 month cycle is down.  The 2 year cycle is up.  The 1 year cycle is down.  Here is the SPX:


Not shown is the 10 year cycle,  The more dominant cycles (historically) are the 10 year, the 41 month and 2 year cycles.  The 10 year cycle will not bottom until spring of 2012.  The 41 month cycle will bottom in the same time frame as the 10 year cycle.  The 2 year cycle will bottom after the 10 year cycle in 2012,  Supposedly there is a K-wave (about 56 years) cycle that will bottom sometime between 2012-2014. 

So the long term cycle environment is fairly negative and these longer cycles should start exerting more influence as they push toward a bottom.  I would expect that influence to become more pronounced after mid-Oct when the 2 year cycle tops.  Keep in mind - even though a long term cycle may have a large amplitude that influence is spread over many, many  days so the daily influence may be small and more than offset by shorter cycles whose daily influence is spread over a much shorter time (fewer days) and have a larger daily influence.  In the long run though the persistence of the long term cycles will make its effect felt.  That influence becomes most pronounced as the cycles approach a bottom as the shorter cycles become unable to offset the persistent effect of the longer cycles.

GL traders.

Friday, February 4, 2011

The week ahead 2-7

I had expected a downward bias this past week.  Did not happen.  I did tell you the market was not ready to fall substantially though and pointed out two cycles that were up for the week (knew it was possible the week would be up, but thought the longer cycles would have a bit more influence than they did).  So not a good week as far as my expectations were concerned.

Still the market did not make a great deal of upside progress.  All the medium term cycles should (by now) have turned down.  I have tried hard to make sure I have positioned all cycles properly - because I felt we are at a turning point....  The evidence is that we have reached that pivot point.  Even bears deserve a day, a week or two weeks every now and then.  So I am going out on a limb - not only will we be down next week, but we should be down hard.  A 5-6% down would not surprise me.  Not only will next week be down, but so will the following week.  IMO - if we are to get a 10% correction the next 2 weeks is the best setup we have had since last May.

What will trigger the sell off?  I am not sure. Today's employment #s could contribute? Egypt? Default by Ireland?  Take your pick.  Maybe the combination of more than one thing.

Here  is the SPX chart:

If you disagree, please state the bullish case for the next 2 weeks.  Give me a chance to consider the bullish case and possibly change my mind.

GL traders.  Make sure you do your DD.  This is as "bearish" as I have been in a few months.

Update:  Momey flow (T-theory) is projecting a top Feb 14 (one week from Monday): http://www.ttheory.com/

Thursday, February 3, 2011

02-04 per Shadow7

Lower the hammer?  "I think the hammer comes down tomorrow."


Gettimg close to T-Theory pivot point: http://ttheory.typepad.com/.a/6a00d83455c65c69e20148c82229b8970c-pi

GL traders.  Do your own DD

NIKE, MSB, MGA 02-03

Looks like it may be good for a trade:

MSB potential buy:

MGA - need to wait for this one:

Do your own DD.  GL traders.

2 to watch for a potential short

Here are a couple that may be short candidates next week.  Do your own analysis please.

Don't anticipate - wait for signals.  GL traders.

Update:  VASC issuing buy signals....  Do your own analysis.

02-03 update GRM

Has reached a 6 month cycle top, just as two short cycles bottom.  This limits downside potential at this time, co even though CCI issuing SELL not an ideal short situation IMO.

GL traders - do your own DD.

update CREE 2-1

It has been a while since we have looked at CREE.  Last time it was upper 60s.  I was not positive on it at that time.  It has since had a sell off and is testing 50 (I waited a few days after it plunged to get a better read on it).  It now looks like a better prospect to buy.  Here are the charts:

Be sure to do your own research and analysis.  GL traders.

02-03  CREE has moved up about 4%  much as expected.

Short candidate update

I had posted ITG might be a short candidate  a week or so ago.  Even though it looks like ITG is ready to issue sell signals I have reviewed it and do not feel it will make a good short candidate at this time.  Here is the chart with annotations showing why:

GL traders

1-30  Update - ITG should be at a point to considered for a short within a couple of days as the 45td cycle and 90 day cycle top together.  Here are charts:

GL traders.  Do your own analysis

02-03  ITG had the expected sell down today.

Wednesday, February 2, 2011

comments and 02-03 outlook

Did not get the expected sell off in the afternoon.  Not a great call.  Adjusted middle cycle length some.  Looks like we get a down day tomorrow....  We will see.

Here is the chart:

GL traders.  Do you own analysis.  Keep in mind shorter cycles may be over powered by longer cycles (see outlook for the week).

Tuesday, February 1, 2011

Comments and outlook for 02-02

Okay, pushed higher than I thought it would,  Sold QID Monday AM as I indicated I intended to do.  Bought back QID trading shares today at $10.65 and was down at the close.  Should be able to sell sometime in the next 2 days profitably.  Also, unloaded some other stocks I had been holding for a while.  So I now hold a lot of cash (80%)   and short positions.  I need to find a long position to have more balance.

Took a look at the shorter cycles.  If right we push a little higher in the morning and top before noon as 2 cycles top together and pull back in the afternoon.  Here is the chart I viewed:

GL traders.  Do your own analysis please - do not act solely on my opinion - that is a good way to lose $s.