
Thursday, December 30, 2010
12-30 T-Theory chart
Looks like Landry expects a low in early March, so a top mid January would seem to fit that projection. Here is the T-Theory chart:

12-20 sell signals starting to appear
Looked at about 20 large cap companies and CCI has dropped below +100 for JPM, PFE, ORCL, AMZN, AAPL, MSFT and GLW within the past 1-4 days. This is one of the things I use as a "sell" signal. Looks like January could get interesting if this trend continues and more stocks generate "sell" signals.
Happy new year everyone.
Update 12-31:
The CCI is a versatile indicator capable of producing a wide array of buy and sell signals.
Happy new year everyone.
Update 12-31:
The CCI is a versatile indicator capable of producing a wide array of buy and sell signals.
- CCI can be used to identify overbought and oversold levels. A security would be deemed oversold when the CCI dips below -100 and overbought when it exceeds +100. From oversold levels, a buy signal might be given when the CCI moves back above -100. From overbought levels, a sell signal might be given when the CCI moved back below +100.
- As with most oscillators, divergences can also be applied to increase the robustness of signals. A positive divergence below -100 would increase the robustness of a signal based on a move back above -100. A negative divergence above +100 would increase the robustness of a signal based on a move back below +100.
- Trend line breaks can be used to generate signals. Trend lines can be drawn connecting the peaks and troughs. From oversold levels, an advance above -100 and trend line breakout could be considered bullish. From overbought levels, a decline below +100 and a trend line break could be considered bearish.
Wednesday, December 29, 2010
12-29 mid week cycle update
No change from the weekend. We have 2 swing cycles ready to bottom (turn up), 1 down and the 1 year cycle to turn down within days (early Jan?). Given 3 days up I would say the chance are better than 50-50 we end the week up, even though we mught get a pullback on bottoming cycles. In total though it appears cycles are offsetting (swing cycles and longer cycles). No sell signals yet, though they may be forthcoming soon (and may not?).
Here is the SPX:

Here is the SPX:

12-29 CREE cycle update
Cree did not achieve the expected downside. Appears we are getting cycles bottoming and may get an alignment of buy signals soon. Wait for the signals to make a move.
Here is a chart:

Here is a chart:

Monday, December 27, 2010
12-27 cycle updates CF, NUE
CF looks close to topping, but may be 2-3 days from giving signals. Hold with tightened stops and see if signals happen...
Here is a chart:
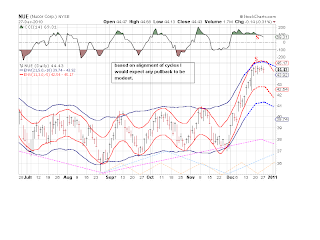
 NUE looks like it set a top on a longer cycle, but 2 shorter cycles are up. So any pullback at this time will probably be moderate (2-3 points). Wait for buy signals?
Here is a chart:
Here is a chart:

Here is a chart:

Sunday, December 26, 2010
12-26 cycle update for OIL
If you traded based on my last post I hope you stayed nimble. Gains were fleeting and not nearly as big as expected. Still there was enough volatility for a couple of quick trades.
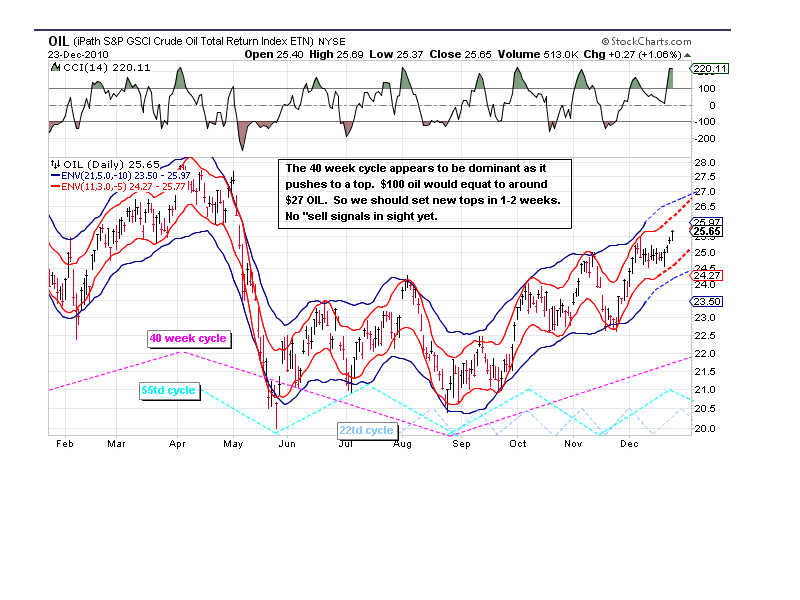
Now it appears the commodity oil is set to make a higher trading channel. It has moved comfortably above $90 a barrel and there is no hint of a sell signal on the OIL chart.
See for yourself:
 GL traders, do your own DD
!2-30 midday - CCI issued a sell signal on OIL this morning....
Now it appears the commodity oil is set to make a higher trading channel. It has moved comfortably above $90 a barrel and there is no hint of a sell signal on the OIL chart.
See for yourself:
!2-30 midday - CCI issued a sell signal on OIL this morning....
Saturday, December 25, 2010
12-25 cycles and the week ahead
I told you last weekend "In total though the longer cycles are providing upside momentum (with the 1 year cycle dominating).
This is offsetting any dowside momentum from shorter swing cycles and giving us a sideways market." Check, the market was sideways (S&P up less than 1% - 1246-1257). Mid-week I told you "A pullback to the 1240 range over the next 2 days seems possible. But with the longer cycles pushing higher I would say the possibility of this is no more than 50-50." Well, we did not get any pullback worth talking about. 50-50 was about correct with a slight up close Wednesday and a mixed close Thursday. Not a perfect call, but not a bad call either.
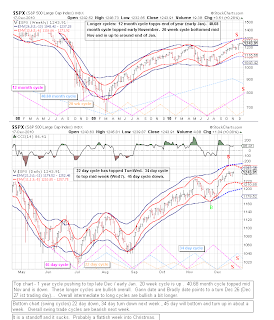
So what lies ahead next week. More of the same? Let's take a look. The 1 year cycle should top by early January. Maybe as early as Dec 27 if you believe the Gann and Bradley turn dates. The 20 week cycle is up into early February. The 41 month cycle topped Mid November and is down . The 6 month cycle is also down, It appears in total longer cycles should largely offset. If the 1 year cycle tops next week maybe a slight down bias (but, I think that will happen in January).
See for yourself:
 So, with the longer cycles in a standoff we turn to the shorter swing cycles, It appears the 34td (trading days) cycle turned down last week. The 45td cycle is down and shoul bottom by the end of the week. The 22td cycle is also down next week. So the sum of the shorter seing cycles appears to be down.
Given this alignment of the shorter swing cycles and the longer cycles we should have a decent chance of a down week. I would say probably 80-20 odds of some pullback between Christmas and New Year. Maybe 1.5-2% pullback (15-20 points?). One would expect some support around 1237 (the prior top in November). And at the very least any upside looks very limited.
See for yourself:

Merry Christmas. Ho Ho Ho
Update - 10-26: China raises interest rates. How will this affect our markets? Could it be the straw that breaks the bull's back? http://www.bloomberg.com/news/2010-12-25/china-raises-interest-rates-by-25-basis-points-in-bid-to-curb-inflation.html
This is offsetting any dowside momentum from shorter swing cycles and giving us a sideways market." Check, the market was sideways (S&P up less than 1% - 1246-1257). Mid-week I told you "A pullback to the 1240 range over the next 2 days seems possible. But with the longer cycles pushing higher I would say the possibility of this is no more than 50-50." Well, we did not get any pullback worth talking about. 50-50 was about correct with a slight up close Wednesday and a mixed close Thursday. Not a perfect call, but not a bad call either.
So what lies ahead next week. More of the same? Let's take a look. The 1 year cycle should top by early January. Maybe as early as Dec 27 if you believe the Gann and Bradley turn dates. The 20 week cycle is up into early February. The 41 month cycle topped Mid November and is down . The 6 month cycle is also down, It appears in total longer cycles should largely offset. If the 1 year cycle tops next week maybe a slight down bias (but, I think that will happen in January).
See for yourself:

Given this alignment of the shorter swing cycles and the longer cycles we should have a decent chance of a down week. I would say probably 80-20 odds of some pullback between Christmas and New Year. Maybe 1.5-2% pullback (15-20 points?). One would expect some support around 1237 (the prior top in November). And at the very least any upside looks very limited.
See for yourself:

Merry Christmas. Ho Ho Ho
Update - 10-26: China raises interest rates. How will this affect our markets? Could it be the straw that breaks the bull's back? http://www.bloomberg.com/news/2010-12-25/china-raises-interest-rates-by-25-basis-points-in-bid-to-curb-inflation.html
Thursday, December 23, 2010
12-23 T-Theory
…Of everything I read Terry Laundry’s Magic T Theory made the most sense to me. …Terry was an eccentric genius living out on Nantucket Island. He was a fellow Marine, a jughead, who’d graduated from MIT and was now using his considerable engineering skills to analyze the market. Terry believed that the market spent the same amount of time going up as it did going down…When you look at the letter T, hence, the Magic T Theory…With the Magic T there was order in the universe a high and low tide every…The Magic T and I became as one.
 Happy Holidays
- Marty Schwartz, legendary trader and author of the “Pit Bull"
To me T-Theory looks like just a different way of looking at cycles. I am no expert on T-Theory, but thought you may find it interesting. I have attempted to construct a T-Theory chart for the S&P. Red Bars under performance, green bars over performance. Looks like the over performance period should be ending.
See for yourself:

Tuesday, December 21, 2010
12-22 mid week cycle update
We keep grinding higher and higher as the longer cycles up more than offset the medium and short cycles down. Based on market action you get the feeling though that there is little or no upside left. But feelings are not analysis.
We could get some down action as early as tomorrow as the 34 day cycle tops and turns down. A pullback to the 1240 range over the next 2 days seems possible. But with the longer cycles pushing higher I would say the possibility of this is no more than 50-50. It appears though the possibility of a pull back increases the week after Christmas as the cycle that has been pushing up since July 1 should top (180 days).
So be on alert for weakness Wed/Thur and increase vigilance after Christmas.
Here is the SPX:
 Gl traders - keep your stops fairly tight so you don't give a lot of your gains back if we get a down trend soon.
We could get some down action as early as tomorrow as the 34 day cycle tops and turns down. A pullback to the 1240 range over the next 2 days seems possible. But with the longer cycles pushing higher I would say the possibility of this is no more than 50-50. It appears though the possibility of a pull back increases the week after Christmas as the cycle that has been pushing up since July 1 should top (180 days).
So be on alert for weakness Wed/Thur and increase vigilance after Christmas.
Here is the SPX:

Monday, December 20, 2010
12-20 tomorrow's outlook
Looking at positioning of shorter cycles it appears tomorrow should be down. The 5.5 day cycle is down and the shorter 12-13 hour cycle appears to have topped and ready to turn down.
See for yourself:

See for yourself:

Saturday, December 18, 2010
12-18 CF cycle update
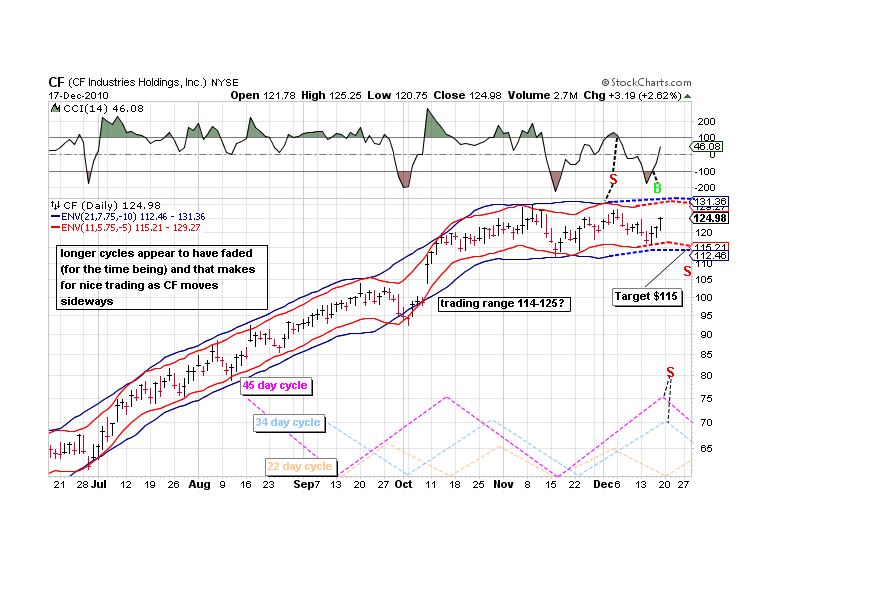
CF has been trading in a sideways channel for almost 3 months. The longer cycles appear to be cancelling out for the time being. This leaves the "swing trade" short cycles moving CF up/down within this channel. This makes for a very nice swing trading situation.
The channel appears to be in the $114-125 range. Probably a buy around $115 and a sell around $125. This will get you the most of the middle part of the move. You rarely will catch an exact bottom or top!!!
Right now CF is nearing a sell point and two cycles should turn down next week. So it is time to sell or set tighter stops.... No need to give your profits back to Mr Market.
See for yourself:
 GL and happy Holidays traders.....
The channel appears to be in the $114-125 range. Probably a buy around $115 and a sell around $125. This will get you the most of the middle part of the move. You rarely will catch an exact bottom or top!!!
Right now CF is nearing a sell point and two cycles should turn down next week. So it is time to sell or set tighter stops.... No need to give your profits back to Mr Market.
See for yourself:
12-18 CSCO update
About 9 days ago I told you: "It appears we currently have 2 shorter cycles up for about 5-6 trading days. It also appears very limited upside ($19.90-20.00). I do not see a lot of upside or downside at this time - trade in a $19-20 range for now IMO." This appears to have been the case,
So what is ahead for CSCO? From a rational basis one might expect some tax selling of CSCO over the next few days into the end of the year. But, what are the cycles saying? The 22 day cycle topped on Thursday I believe. The 34 day cycle topped on Monday it appears. The 45 day cycle was down and should bottom near the end of December. So this suggests we will get tax selling the next few days.
By the end of the year all 3 of the cycles should have bottomed. So you may want to buy CSCO the last couple of days of 2010 or the first day of January. The downside target for buying should be $19.00-19.10. Keep in mind CSCO has indicated they will institute a dividend and that should provide some impetus to the upside in the new year (might break out and exceed the $19.90-20.00 resistance).
See for yourself:

GL and Happy Holidays traders.
12-18 cycles week ahead
The past week was not one of my better weeks in figuring out what the market would do. Many were predicting surges higher to S&P 1260 or higher while I was looking for a pullback. They were wrong (as was I) as the market was flat for the week.
I warned you in my header statement that at times I will be wrong, that I will misinterpret the data. So my task was/is to figure out where I went wrong. Since I look mostly at shorter (swing trade) cycles I believe that the longer cycles were impacting the markets in a way for which I had not accounted. So I took a closer look at the longer cycles. I believe that I now understand what is happening.
The 1 year cycle is pushing up hard to a top (Dec 26 is 180 days from the July 1 low). As I interpret Gann this should be a turn date (see prior post). It is also listed as a Bradley turn date (see post on Bradley dates). It is unusual to go 180 days without a sizable pull back (so we are due for a 10% or so pullback soon). We also have a 20 week cycle that should top around the end of January that is helping to keep the market from pulling back. The 40.68 month (often called a 41 month cycle) topped by mid-November. In total though the longer cycles are providing upside momentum (with the 1 year cycle dominating).
This is offsetting any dowside momentum from shorter swing cycles and giving us a sideways market.
Looking at the swing trade cycles the 22 day cycle topped this past week and is down. The 34 day cycle should top by the middle of next week and turn down. The 45 day cycle is down but should bottom soon. So the total impact of the shorter cycles should be down. But, as noted above this is being offset by the longer cycles.
See for yourself:
Merry Christmas all
I warned you in my header statement that at times I will be wrong, that I will misinterpret the data. So my task was/is to figure out where I went wrong. Since I look mostly at shorter (swing trade) cycles I believe that the longer cycles were impacting the markets in a way for which I had not accounted. So I took a closer look at the longer cycles. I believe that I now understand what is happening.
The 1 year cycle is pushing up hard to a top (Dec 26 is 180 days from the July 1 low). As I interpret Gann this should be a turn date (see prior post). It is also listed as a Bradley turn date (see post on Bradley dates). It is unusual to go 180 days without a sizable pull back (so we are due for a 10% or so pullback soon). We also have a 20 week cycle that should top around the end of January that is helping to keep the market from pulling back. The 40.68 month (often called a 41 month cycle) topped by mid-November. In total though the longer cycles are providing upside momentum (with the 1 year cycle dominating).
This is offsetting any dowside momentum from shorter swing cycles and giving us a sideways market.
Looking at the swing trade cycles the 22 day cycle topped this past week and is down. The 34 day cycle should top by the middle of next week and turn down. The 45 day cycle is down but should bottom soon. So the total impact of the shorter cycles should be down. But, as noted above this is being offset by the longer cycles.
See for yourself:

Merry Christmas all
Thursday, December 16, 2010
12-16 cycles and Gann
Another approach to cycle analysis was developed by Gann. Here is some information on his approach:
http://ptv-investing.com/blog/2009/08/01/how-to-use-gann-fans-and-time-cycles/
I have tried to provide you a Gann Circle based on more recent data:
 And a Gann Fan chart using dates from the above circle:

I am no expert on this methodology, but felt it might interest you.
http://ptv-investing.com/blog/2009/08/01/how-to-use-gann-fans-and-time-cycles/
I have tried to provide you a Gann Circle based on more recent data:


I am no expert on this methodology, but felt it might interest you.
12-16 mid-week update
Definitely appears the 22 day cycle topped and turned down. We now have multiple sell signals triggered. The 34 day cycle should top next week triggering one more sell signal. I would expect the next few days to continue to show a downward bias. Probably will not get the 2% down this week I thought we might when I posted my weekly outlook, but one decent down day could still give us that.
This will not be some "huge" sell down but a tradable swing cycle.... Let's see how it plays out before we make any crazy predictions. If we get to 1220 S&P let's see where we are within the cycles before we start looking for lower levels.
The 45td (trading day) cycle will bottom soon, but this cycle has not shown much amplitude since August so I am unsure if this will have much impact. Time will tell.
Here is the current chart (SPY):
 gl traders, be sure to do your own analysis and use this as input into that process.
This will not be some "huge" sell down but a tradable swing cycle.... Let's see how it plays out before we make any crazy predictions. If we get to 1220 S&P let's see where we are within the cycles before we start looking for lower levels.
The 45td (trading day) cycle will bottom soon, but this cycle has not shown much amplitude since August so I am unsure if this will have much impact. Time will tell.
Here is the current chart (SPY):

Wednesday, December 15, 2010
12-15 Bradley turn dates 2011
2011 Bradley Turn Dates List
3 most important dates
Feb 17, 2011
July 29/30, 2011
December 28, 2011
· 2/3/2011
· 6/15/2011, 6/22/2011
· 8/20/2011, 8/30/2011
· 9/26/2011
· 10/12/2011, · 10/28/2011
· 11/22-23/2011

Tuesday, December 14, 2010
12-15 Cree cycles
I alerted you back on 12-06 that the 22 day and 34 day cycles were approaching tops and it was time to start thinking of taking profits. It appears those tops are in (as well as a 45 day cycle). The gap from back in August was closed (as I believe I mentioned might happen).
Now with 3 cycles down CREE dumped today as one might expect when 3 cycles align to the downside. I have a target for the week under $65. Time will tell - low $60s are possible by next week. So you should have gotten stopped out today if you had not already sold.
The play now would be to short CREE or if you want to limit the $s at risk to buy puts $65 or less. See for yourself:

Gl traders....
12-14 cycles update
Today saw the CCI drop below the +100 level triggering a cycle "sell" signal. Second, the 22 day cycle top is a "weak sell" signal. Third, my projections show intersection of the upper envelope channel lines (a "sell" signal).
So all the signals are in place. Suprised we closed green today even if just barely on S&P. With cycles signals on "sell" and given all the other indicators (see prior post) - can the bulls continue to push higher. I suppose it is possible, but I'd put the odds 3 to 1 in favor of a pullback.
Here is the SPY - see for yourself:
 GL trading.
So all the signals are in place. Suprised we closed green today even if just barely on S&P. With cycles signals on "sell" and given all the other indicators (see prior post) - can the bulls continue to push higher. I suppose it is possible, but I'd put the odds 3 to 1 in favor of a pullback.
Here is the SPY - see for yourself:

Monday, December 13, 2010
12-13 other indicators
As you know I primarily use cycles in my analysis. That doesn't mean I ignore other disciplines, just it is not my primary focus. So let's look at some other indicators.
I. There is a large inverted H&S pattern. The pattern has fulfilled its upside projection for the right shoulder and should no longer offer upside support.
II. There is a time based Fibonacci (see previous post which referenced David Knox Barker) that is now complete. It is 21 months since Mar 9, 2009 low and 21 is a Fibonacci number (Fibonacci series 1, 1, 2, 3, 5, 8, 13, 21, 34, etc).
III. There is a price based Fibonacci (.618 retrace of top to bottom on Mar. 9) at 1246 that was fulfilled today.
IV. CPC and CPCE (call/put ratios) are at extreme bearish levels. See chart 1.2: http://stockcharts.com/def/servlet/Favorites.CServlet?obj=ID3729231
V. Sentiment levels have become extremely biased to the bullish side (contrarian indicator). "Dumb" money measurement at very high levels (bearish). The VIX (yes it is a sentiment indicator) is near April lows.
VI. Very extreme reading on the ARMS (TRIN) indicator over the past 10 days. See chart 1.2: http://stockcharts.com/def/servlet/Favorites.CServlet?obj=ID3729231
You get the idea. Combine this with cycle analysis indicating an imminent turn and you have to believe the long side has become extremely risky (see weekend post).
GL traders.
Saturday, December 11, 2010
12-11 the week ahead
December has started off by pushing higher, wiping out the .9% down in November and setting new 52 week highs on most indexes.
Next week Monday may be up, after that I expect the 22 day cycle to top and turn down. So overall I expect next week could prove to be a challenge for the bulls. I do not think we break out and go above 1250 S&P (yeah, I know some are suggesting 1280-1300) and could finish down 2% or more based on the expected alignment of cycles next week.
I told you last weekend: "I anticipate we will get new highs. I do not expect the market to continue up as strong as it did Wed-Fri of last week." Check. I told you in my December look ahead: "The market will remain choppy with a downward bias the first 2 weeks of December.". Oops, missed it on the bias (so shoot me). I also said: "The cycles align to the downside and we could get a more substantial sell down the second half of December.". I believe this will be true, time will tell.
Lets review that alignment:
5.5 day cycle down Mon-Wed
22 day cycle topping and down Tue-Fri
45 day cycle down
24 month cycle down until end of Mar
40.68 month cycle down
10 yr cycle down
34 day cycle up
1 year cycle up until late Jan
With this alignment the 5.5 day and 22 day cycles could give us a substantial selloff Tue/Wed. Overall the sum of the cycles I track should provide a down market. Also the "sell" signals have started to appear. Here is the SPX chart:

GL, I hope this provides a supplement to your analysis not the main driver of your trades.
Thursday, December 9, 2010
12-09 CSCO revisited
A very ugly chart, given the huge gap down. It appears we currently have 2 shorter cycles up for about 5-6 trading days. It also appears very limited upside ($19.90-20.00). I do not see a lot of upside or downside at this time - trade in a $19-20 range for now IMO.
Here is the chart:

Here is the chart:

Wednesday, December 8, 2010
12-08 mid week cycle update
I told you in my weekend post: "I anticipate we will get new highs. I do not expect the market to contine up as strong as it did Wed-Fri of last week." Check, up but not a lot of strength and we set new highs.
Not much has changed - continued attempts to the upside and probably new highs. Be skeptical of those calling for 1280-1300 by year end. It could happen, but from a cycle view it seems unlikely. By early next week the 22 day cycle tops and by the end of the week the 34 day cycle should be near a top. For now the bias is up. By mid-month the bias should change to down for at least a couple of weeks. Remember we are looking for shorter swing cycles we can trade .
Here is an current chart for the SPX:
 Remember - always do your own analysis - this is only a check on that analysis and should not be the sole reason to enter/exit a position..
NOTE: added updated chart to OIL post.
Not much has changed - continued attempts to the upside and probably new highs. Be skeptical of those calling for 1280-1300 by year end. It could happen, but from a cycle view it seems unlikely. By early next week the 22 day cycle tops and by the end of the week the 34 day cycle should be near a top. For now the bias is up. By mid-month the bias should change to down for at least a couple of weeks. Remember we are looking for shorter swing cycles we can trade .
Here is an current chart for the SPX:

NOTE: added updated chart to OIL post.
Monday, December 6, 2010
12-06 OIL topping soon
Looks like we should get first sell signals by mid-week and multiple sell signals by first of next week. You know the play? Buy DTO maybe.


See for yourself:


Here is an updated chart (as expected all the sell signals are lined up).
12-06 CREE - time to take profits
It has been a nice ride, but it is time to lock in profits. The 22 and 34 day cycles are topping. CCI has pulled back under +100. My channel projections should touch. So all the "sell" signals confirm each other.
See for yourself:

See for yourself:

Sunday, December 5, 2010
12-05 from the net - more on cycles
http://www.safehaven.com/article/19208/turning-points
>> SPX: Intermediate trend - Technical observations point to a potential intermediate top in mid to late December. <<
http://staticorigin.seekingalpha.com/instablog/619720-david-knox-barker/113172-demystifying-the-s-p-1228-target-that-killed-the-rally Next top projected end of week, which is close to the top the 22 day cycle IMO.

Saturday, December 4, 2010
12-05 weekly cycle update
The strength of the up move Wed-Fri was surprising. It should continue thru next week until we get the 22 day and then 34 day cycle topping. I anticipate we will get new highs. I do not expect the market to contine up as strong as it did Wed-Fri of last week.
Decide for yourself - here is a chart of the SPY:

Something I found interesting ( http://www.safehaven.com/article/19203/stock-market-cycles-virtuous-circles-and-trillions-of-dollars ):
>>The real question here is whether the Federal Reserve should just focus on prices, or possibly only enforcing bank regulation, especially higher capital requirements, reasonable down payments, and no liar loans. Business cycles and stock market cycles are natural events that serve to reallocate capital and separate the winners from the losers. The Federal Reserve should not be messing with Mother Nature.
How should this knowledge of cycles running longer affect the decision making of investors and traders? Long Wave Dynamics has discovered the natural lengths of stock market cycles. Research is producing actionable information for investors and traders on market cycles in price and time. The long wave contains sixteen business cycles. Every business cycle (aka Kitchin cycle) contains nine Wall cycles (aka 20-Week cycle). Cycles are rarely their natural or "ideal" lengths, like market prices they are guided by Fibonacci ratios. Cycles running longer than their natural lengths are to be expected as long as central bankers are pursing virtuous circles. Tracking the Wall cycle and the Fibonacci ratio targets to tops and bottoms is essential for all serious investors and traders.<<
So 9 cycles of 20 weeks is 180 weeks. That is 3.46 years (180 / 52) or fairly close to 3.39 years that I have discussed. A smidge closer if we consider that 7 x 52 is just 364 days per year.
Thursday, December 2, 2010
12-02 Regional banks
GS today issued positive statements on the banks. In Oct I had looked at the regional bank index and told you they were in an uptrend. I decided to look again. They are still in an uptrend, but GS is late to the party as they should be at a decision point by the end of Dec.
See for yourself:

See for yourself:

12-02 NUE --- know when to fold them
Over the past several months NUE has presented you with several nice trading ops. But, we have to know when to leave so as not to overstay our welcome. Today I sold my NUE. Why? Because in December two longer cycles top and turn down and this increases the downside risk. The next downturn in NUE could see it drop below the recent $37 support and if it does the low $30s look attainable.
So IMO there is $8-10 of doewnside risk and maybe $1 more to the upside. I don't like those odds so I will watch from the sidelines.
Look for yourself:

So IMO there is $8-10 of doewnside risk and maybe $1 more to the upside. I don't like those odds so I will watch from the sidelines.
Look for yourself:

Wednesday, December 1, 2010
12-01 mid-week cycle update
Doesn't look like we break below 1173 as I thought we might (see week end post). Also, I doubt we end lower for the week as I opined over the week end. Today's action should have gotten your attention. It got mine.
We have had cycle after cycle bottom over the past 2 weeks and turn up (22 day cycle, 34 day cycle). 45 day cycle is up for 2-3 more days before it tops. So these 3 cycles are now up... The 4 month (or 90 trading days) cycle topped and is now down. Given this imbalance of cycles up versus cycles down the next 3-4 days should tilt up at least until the 45 day cycle tops around Dec 6, followed shortly after by the 22 day cycle. After that we will see.
While it is true there are longer cycles down I do not believe that is enough to overcome the shorter cycles for now. Keep in mind even though the longer cycles may have larger amplitudes it is averaged over longer periods. For example let's say the 22 day cycle has an amplitude of 11 SPX points from bottom to top (or top to bottom). A half-cycle (bottom to top or top to bottom) is 11 days for an average impact of 1 point a day. On the other let's say the 24 month cycle has an amplitude of 150 SPX points. A half-cycle is 1 year (about 250 trading days). So the impact is about 6/10 a point per day on average. So the shorter cycle wins as it is 4/10 point stronger per day on average. Hope this makes sense???
Here is how it looks for now:

Subscribe to:
Posts (Atom)